
Beta Compression
Why a Four-Beta Semiconductor Stock Might Fall Only 8% When the Index Falls 3%

A high-beta stock can become more volatile and more correlated with the market during a selloff while its beta still falls. The reason is that beta is correlation multiplied by the relative volatility between stock and index, and the index-volatility denominator can reprice faster than the stock-volatility numerator due to the effect of implied correlation on index.
Typical High-Beta Observation
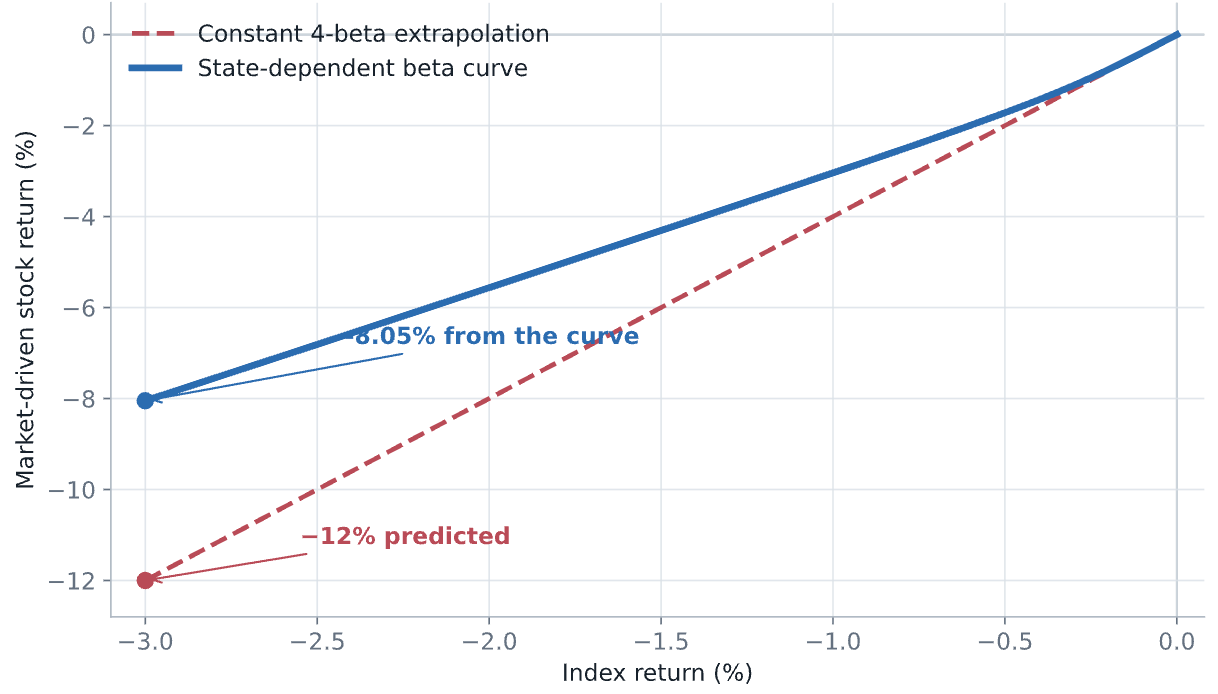
Suppose a semiconductor stock is commonly described as “four beta.” On ordinary days a 1% move in the index is often accompanied by something like a 4% move in the stock. It is tempting to extend the same line and say that a 3% index decline should produce a 12% stock decline in expectation.
Then we observe multiple occasions where index falls 3% and the stock falls only around 8%. The usual reaction is to search for an idiosyncratic story. But there is a simpler possibility that the stock may genuinely be four beta near spot while having a much lower beta over a large move.
The Central Equation
The central idea is not that the original beta estimate was wrong but that a beta estimated around one state does not have to describe the entire path to another state.
The ordinary definition of beta is the covariance of the stock with the market divided by the variance of the market:
Writing covariance as correlation multiplied by the volatilities of the two assets:
This equation separates two questions that are often blurred together. Correlation asks how tightly the stock and index move together. The volatility ratio asks how large the stock’s typical movement is relative to the index’s movement. A stock can be highly correlated with the index but have only a modest beta if its volatility is close to index volatility. A stock can also have a high beta with less-than-perfect correlation if its own volatility is several times index volatility.
The direction of each effect is immediate. Higher correlation raises beta. Higher single-stock volatility raises beta. Higher index volatility lowers beta, because index volatility sits in the denominator. In proportional-change form:
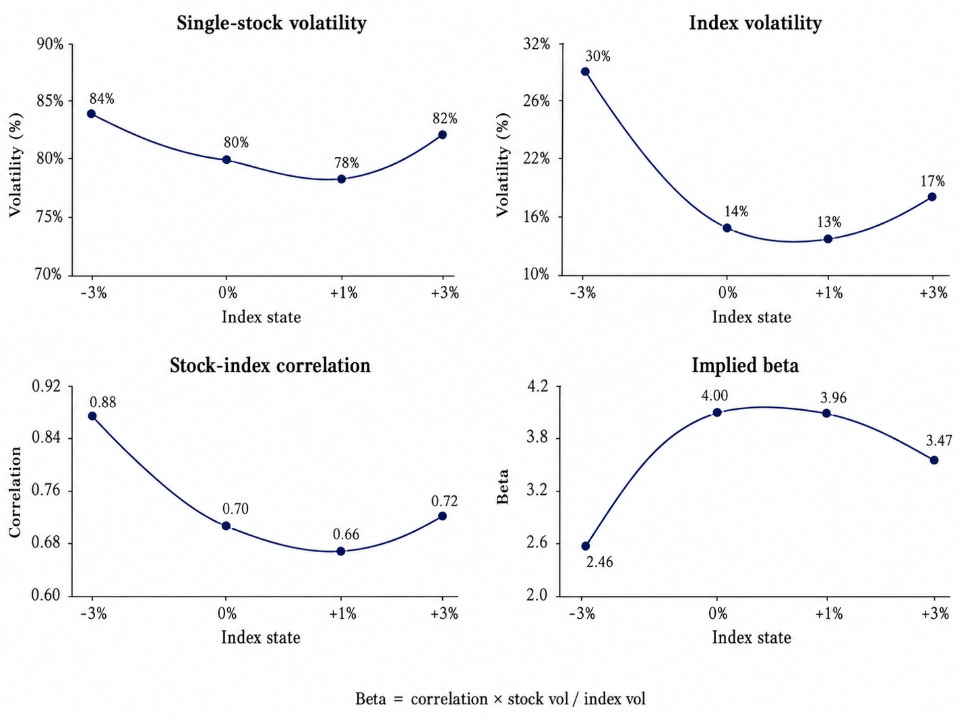
In a selloff, stock volatility usually rises and correlation usually rises, but index volatility can rise even faster. The stock can therefore become more volatile, more correlated, and yet lower beta at the same time. Beta compression does NOT require correlation compression.
Options-Implied Beta Curve
Options provide a forward-looking beta curve via the stock-volatility surface, the index-volatility surface, and an implied correlation surface.
The superscript Q is a reminder that option prices live under the risk-neutral measure. This is not automatically the same as the beta expected under real-world probabilities. But the decomposition is still valuable because it tells us where the option market is embedding the exposure.
Single-stock volatility and index volatility are directly visible in their respective option markets. Correlation is not quoted with the same completeness. Instead, average implied correlation is backed out from the variance identity for a weighted basket which gives the index:
Constituent options tell us how much standalone variance is priced stock by stock. Index options tell us how much total basket variance is priced. The difference is the covariance the market must be pricing. Under an approximation:
Concluding Notes
A four-beta label does not mean that for every 1% market move, regardless of size or state, in expectation produce a 4% stock move. It means that around some reference state, the stock’s covariance with the market is about four times market variance.
As the market moves, the three ingredients of beta move with it. In the stylized semiconductor example, stock volatility rises from 80% to 84%, correlation rises from 0.70 to 0.88, and index volatility rises from 14% to 30%. The stock becomes substantially more macro-driven, but beta falls from 4.00 to 2.46 because the index-volatility denominator reprices fastest.
The beta of the complete 3% index decline is not the spot beta and not the endpoint beta. It is the average local beta traversed along the path. Here that average is 2.68, which turns a 3% index decline into roughly an 8% stock decline.
Historical returns show how that curve has realized. Single-stock and index options reveal the two volatility surfaces. The gap between index variance and constituent variance reveals the market’s aggregate dependence pricing.
Once those pieces are put in the correct order, the apparent puzzle disappears. A four-beta stock falling only 8% when the index falls 3% is not necessarily an anomaly. It may be exactly what the volatility and correlation surfaces imply.
Disclaimer: The information provided on TheLogbook (the “Substack”) is strictly for informational and educational purposes only and should not be considered as investment or financial advice. The author is not a licensed financial advisor or tax professional and is not offering any professional services through this Substack. Investing in financial markets involves substantial risk, including possible loss of principal. Past performance is not indicative of future results. The author makes no representations or warranties about the completeness, accuracy, reliability, suitability, or availability of the information provided._
This Substack may contain links to external websites not affiliated with the author, and the accuracy of information on these sites is not guaranteed. Nothing contained in this Substack constitutes a solicitation, recommendation, endorsement, or offer to buy or sell any securities or other financial instruments. Always seek the advice of a qualified financial advisor before making any investment decisions.