

Cross-Asset Relative Value
Trading Equity Variance Swaps Against Credit CDS

Notes from JP Morgan European Equity Derivatives Strategy 17 November 2006 page 68-69.
Equity Variance and Credit Spreads
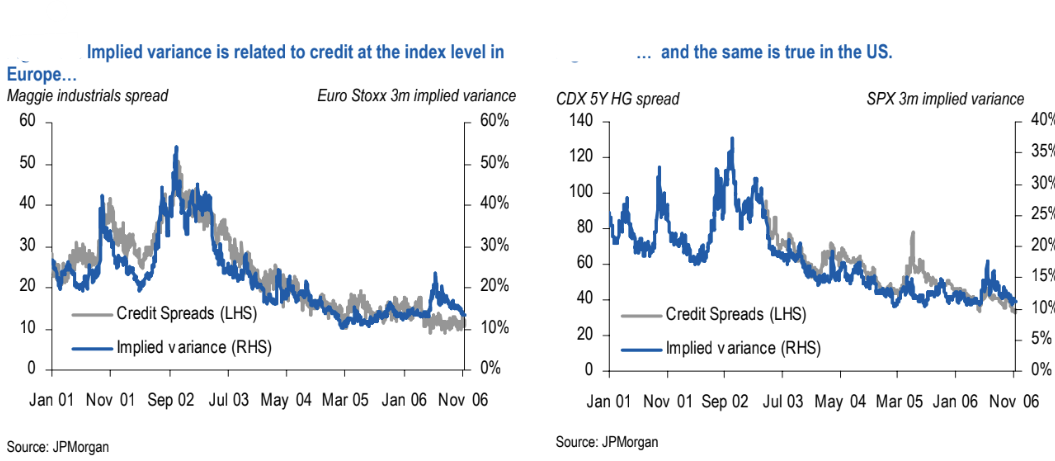
Variance swaps (on equities or indices) and credit default swaps (CDS) both put a price on a firm’s risk. Over time, they should be correlated. This is clear at the index level. Europe: Credit and CDS indices such as Maggie and iTraxx show a strong relationship to Euro Stoxx 50 3-month implied variance. US: CDX HG and HY indices are well correlated with S&P (SPX) 3-month implied variance.
Despite the strong long-run link, short-term dislocations pop up.
May 2005 (credit shock, equity vol muted): Credit sold off after GM was downgraded to non-investment grade, and amid correlation worries in structured credit. The move was pronounced in the US, but SPX implied vol did not jump commensurately.
Credit investors could have sold CDS protection into the dislocation. If that sell-off was actually a macro regime change, equity vol would likely rise, so buying equity volatility against the long credit position (i.e., variance vs CDS) could hedge that macro risk. May 2006 (equity vol spike, credit steady): Equity volatility spiked in Europe while credit markets stayed largely unmoved. A short equity volatility / long CDS position could monetize the price gap while still providing some protection if the regime truly shifted.
Single Stock Relative Value
Index-level trades can be compelling but suffer basis risk: Indices do not share identical constituents across equity and credit baskets. Credit indices can be yanked by idiosyncratic defaults of single companies. Because of that, the majority of debt/equity trading is single-name capital structure work.
Use reduced-form or capital-structure models to link a company’s share price, its credit, and its equity options. A typical relative-value trade: long/short equity puts vs CDS. However, reduced-form regressions of share price (non-stationary) on CDS (more mean-reverting) can mislead. Example: Fiat.
Pre-2004: Fiat 5Y CDS tended to widen when the share price fell through €15.
Post-2004: It took a much lower share price (below €10) to push CDS wider.
Reason: Leverage reduction lowered the price level at which credit assumed distress.
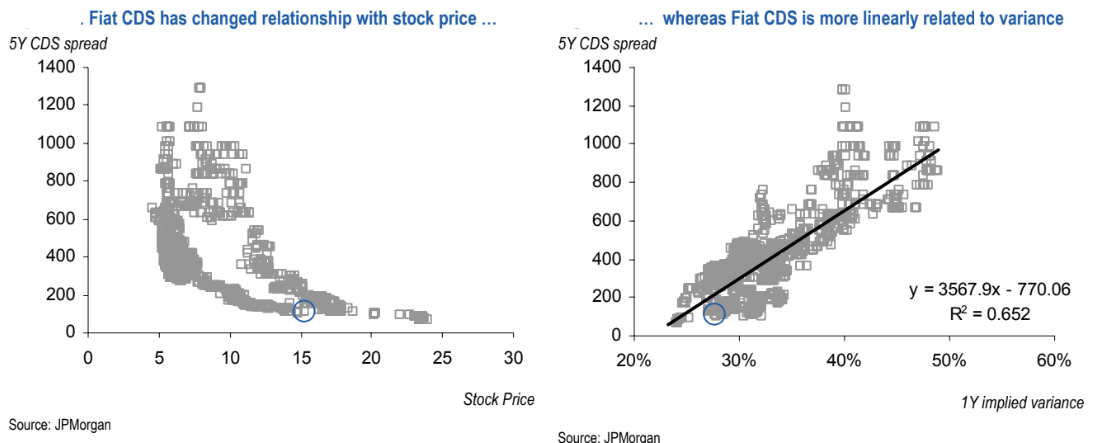
A simple regression would have treated CDS like a €15 strike put on the stock; building a trade with a €15 put against CDS would mis-specify the capital structure. Because implied variance already incorporates some of the reduced risk, the Fiat CDS vs implied variance relationship is more stationary. In practice, traders may use some combination of variance and the underlying equity to express the capital-structure view (not just variance alone).
Disclaimer
The information provided on TheLogbook (the "Substack") is strictly for informational and educational purposes only and should not be considered as investment or financial advice. The author is not a licensed financial advisor or tax professional and is not offering any professional services through this Substack. Investing in financial markets involves substantial risk, including possible loss of principal. Past performance is not indicative of future results. The author makes no representations or warranties about the completeness, accuracy, reliability, suitability, or availability of the information provided.
This Substack may contain links to external websites not affiliated with the author, and the accuracy of information on these sites is not guaranteed. Nothing contained in this Substack constitutes a solicitation, recommendation, endorsement, or offer to buy or sell any securities or other financial instruments. Always seek the advice of a qualified financial advisor before making any investment decisions.