

Market Probabilities are NOT Real Probabilities
They can still be predictably biased under various levels of market efficiency

Prediction markets are often praised for their ability to aggregate information and distill collective expectations into a single price. Naively one may think that these prices should correspond to real-world probabilities, reflecting the best available estimate of an event’s likelihood. Yet, even assuming rational participants, market prices may diverge from true probabilities due to structural distortions; understanding these distortions is crucial for interpreting prediction market outputs.
Prediction Markets
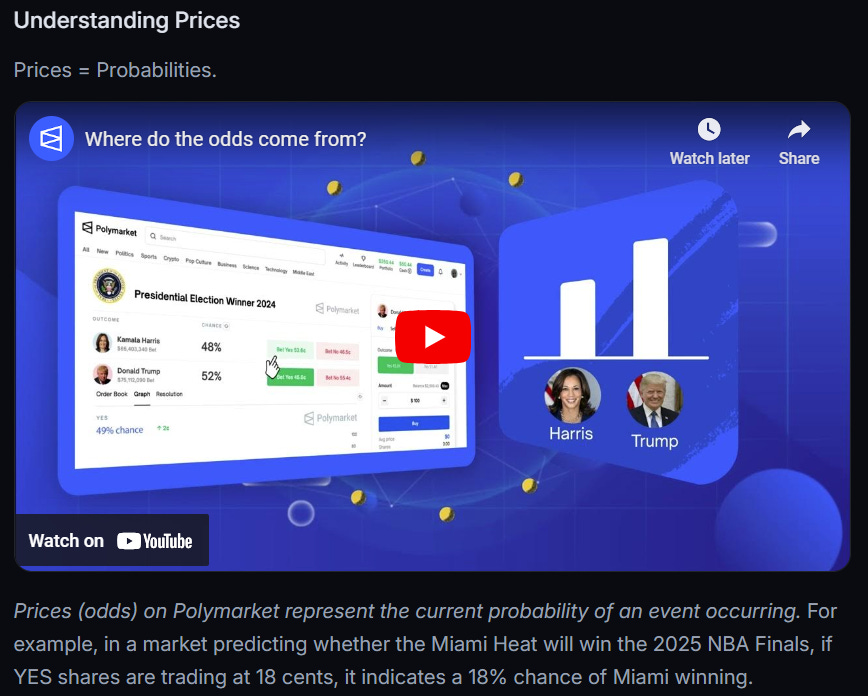
Betting on prediction markets involves purchasing contracts that pay out based on the outcome of a future event. Each contract trades at a price between $0 and $1 (or $0 and $100 in some markets), representing the market’s “implied belief” in that outcome. If the event occurs, holders of the winning contract receive the full payout, while holders of the losing contract receive nothing. Prices fluctuate as participants buy and sell contracts based on their expectations, risk tolerance, and capital constraints. Contracts can be traded at any time before resolution, traders can enter and exit positions dynamically, aiming to profit from price movements rather than just the final outcome.
The widespread interpretation of prediction market prices as direct probabilities is unsurprising, particularly given that platforms like Polymarket explicitly present them as such. For example, here is a screenshot from their own website
Additionally, media coverage consistently reinforces the assumption that market prices equate to probability estimates. Even when skepticism is expressed at market prices, it is typically the rationality of participants that is called into question rather than the idea that prices are probabilities. For example, the commentary below
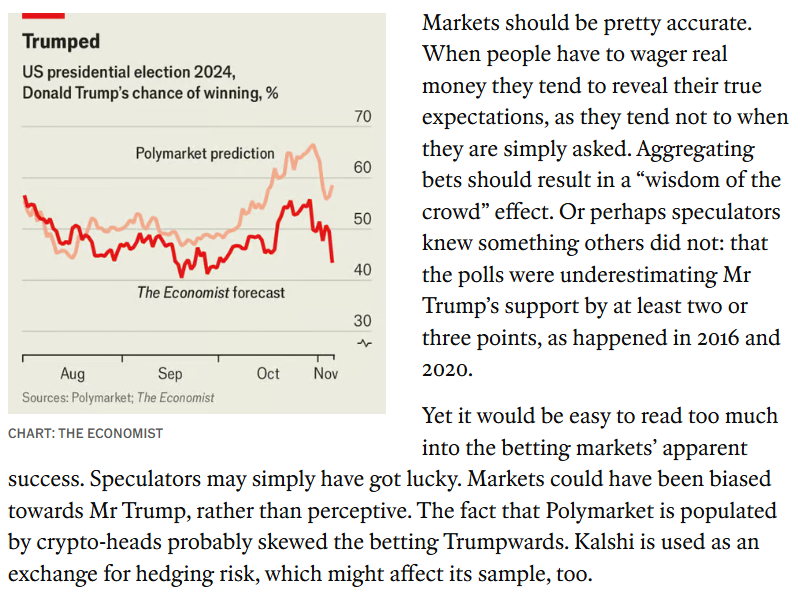
While market participants are indeed not always rational, the purpose of this post is to go further, and show that even under generous assumptions of rationality and efficiency, the prices given by event contracts on prediction markets still deviate nontrivially from what the “true” probabilities participants have in mind.
Favorite-Longshot Bias in Rational Markets
The Kelly Criterion is a mathematical formula used in betting / investing to determine the optimal bet size that maximizes long-term rate of wealth growth while minimizing the risk of ruin (equivalent to maximizing median of terminal wealth distribution i.e. the typical outcome). Proofs for its properties are well-known and can be found on Wikipedia. The criterion is often considered “rational” in academic work and is what market participants would do when maximizing a logarithmic utility function (I have written about this in a previous post).
The optimal fraction of bankroll to bet is
assuming a probability p of winning, that the better loses everything if he doesn’t win, and that the fraction odds offered on the contract is b. A fractional odds of b represent a bet where for every 1 unit wagered, the bettor stands to win b units in profit if successful, plus the return of their original stake. In other words, if the odds are 3/1, a successful $1 bet returns $4 in total—$3 in profit and $1 as the initial stake. If the odds are 1/1, it means an even-money bet where a $1 stake wins $1 in profit, returning $2 total. Fractional odds directly indicate the ratio of profit to stake (commonly used in horse racing and UK markets). To convert to European decimal odds, add 1. To convert to American odds, multiply by 100 if the fraction is greater than or equal to 1, and divide -100 by the fraction otherwise.
For an event contract of price π that returns 1 if successful and 0 otherwise (and therefore an “implied probability” of π, the odds offered to the bettor is
If the better has a subjective probability of p greater than π, the optimal betting fraction is given by
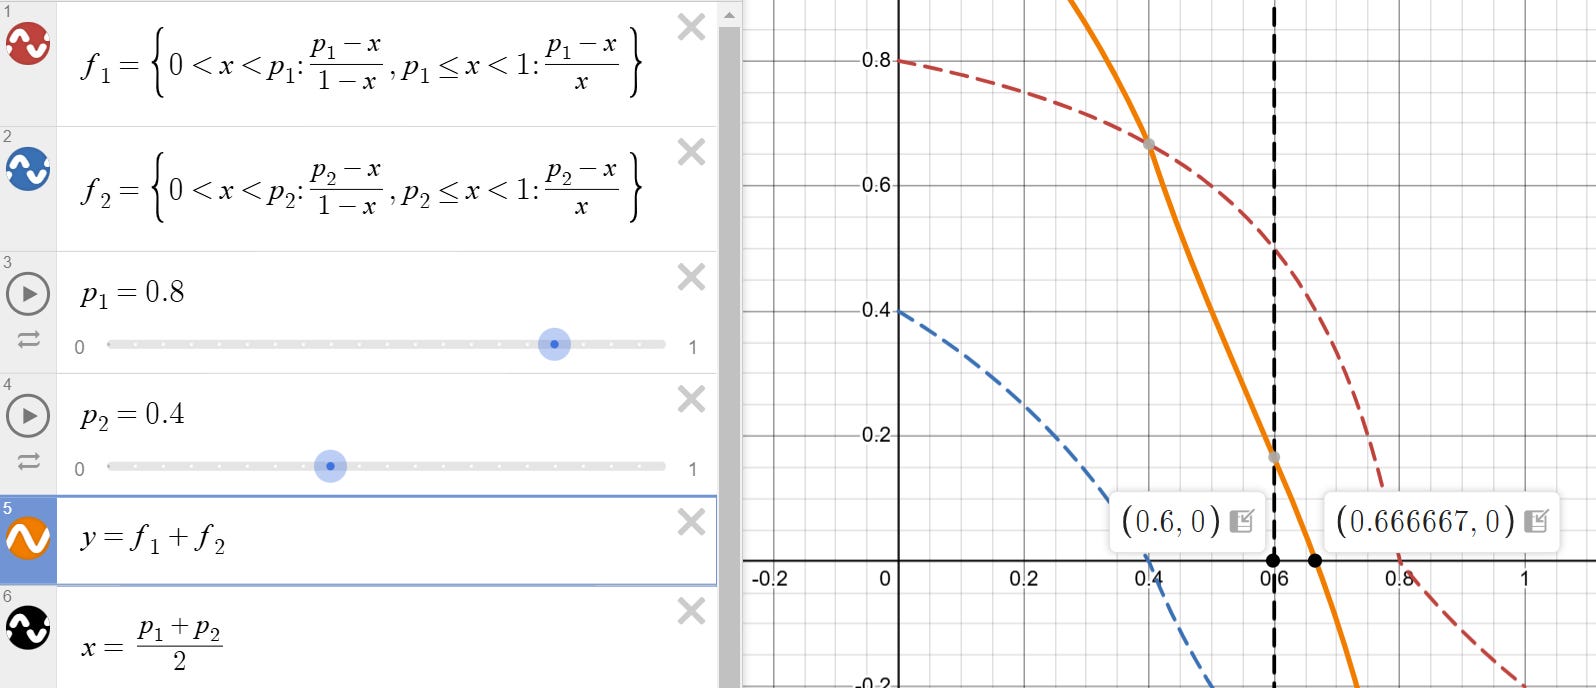
Now, consider a case of two agents both acting rationally by betting their Kelly fractions with equal bank rolls but different subjective probabilities (call these p1 and p2 respectively where p1 > p2). We can determine the equilibrium market price as the price at which both agents bet the same fraction of their bankroll and therefore the same dollar amount (i.e. both agents are willing to exchange the same number of contracts at this price, after which they both no longer want to trade). The question for the reader is, do you expect this price (generally) to be (p1+p2)/2? Take a moment to think about this, I’ve provided an image below to block out the solution.

The astute reader would have discovered that the crossing price for the two agents (where p1 > p2 and assuming same bankroll and Kelly Betting) is given by
Which is evidently not the money / participant weighted average of probabilities. For example, if p1 = 0.8 and p2 = 0.4, the crossing probability would be 2/3 instead of 0.6. I have made a Desmos Simulation for those who want to explore other values (the crossing price is given by the x-intercept of f1+f2 in the graph).
Moreover, the reader will notice that in general, the market crossing price will lean towards the opinion of the more extreme participant when compared to the weighted average of probabilities i.e. the more extreme your opinion is compared to the “true” unobservable probability average, the more you pay to express that opinion. This effect is most extreme when both probability estimates are extreme; if p1 = 0.95 and p2 = 0.85 the crossing price would be 0.9444… instead of 0.9.
The effect remains, though to a less degree, even if both participants Bayesian update their posterior estimates of their probabilities when they trade. Moreover, while our analysis involves only two parties with equal bankroll, it extends naturally to the market equilibrium generated by multiple parties with different bankrolls (probabilities lean towards single parties with big bankrolls as opposed to many parties with smaller bankrolls, see post here). In academic literature the effect is called Favorite-longshot bias where on average bettors tend to overvalue "longshots" and relatively undervalue favorites. Behavioral explanations exist (gamblers are poor at estimating odds and some people may like the payoff structure of longshot bets e.g. parleys) but it is important to note that we have shown that markets can exhibit biased pricing even when all participants are perfectly rational.
The bias arises in rational prediction markets due to the nonlinear relationship between probabilities, odds, and expected returns when participants follow Kelly betting. The implied equilibrium price in the market is determined by the point where opposing Kelly bettors clear the order book. However, because odds scale as the reciprocal of probability, the price impact of a given bet size is highly asymmetric—adjusting a longshot’s probability requires much more movement in odds than adjusting a favorite’s probability. This means that in equilibrium, the crossing price will be disproportionately influenced by the participants willing to bet on longshots, even if all participants bet the same Kelly fraction of their bankroll. As odds increase, the required price adjustment to clear additional bets explodes nonlinearly, causing the final equilibrium price to lean toward the opinion of larger or more extreme bettors. This is a purely mechanical consequence of how odds are structured, rather than a result of overestimation or misjudgment of probabilities, and leads to empirically observed longshot bias in rational markets.
Prices = Expected Returns - Cost of Undiversifiable Risk
We have shown that prediction markets with rational participants can be biased when there is a finite number of participants participating in a finite number of products. However, we can go further to show that prediction market probabilities are not always the “true” consensus probability even when there is an infinite (i.e. large) number of products with an infinite number of participants.
We construct the intuition for this claim by first considering the dividend discount model of asset pricing which states that a stock’s fair price P0 is
where D1 is the annual dividend, g is the expected dividend growth rate, and r is the cost of equity which accounts for the level of risk that the investor takes on (perpetual growth rate cannot be greater than cost of equity else the present value of the stock is infinite!). The formula obviously cannot be used to actually “price” a stock but it does reflect the intuition that the price of a financial asset reflects both its expected value and the compensation for risk. When the price of the stock changes, it is impossible to know (without additional context) whether it is because of changes in investor risk perception or in investor return perception. If there are an infinite number of stocks, then the idiosyncratic risks of each one can be diversified away, but their shared exposure to macroeconomic growth cannot.
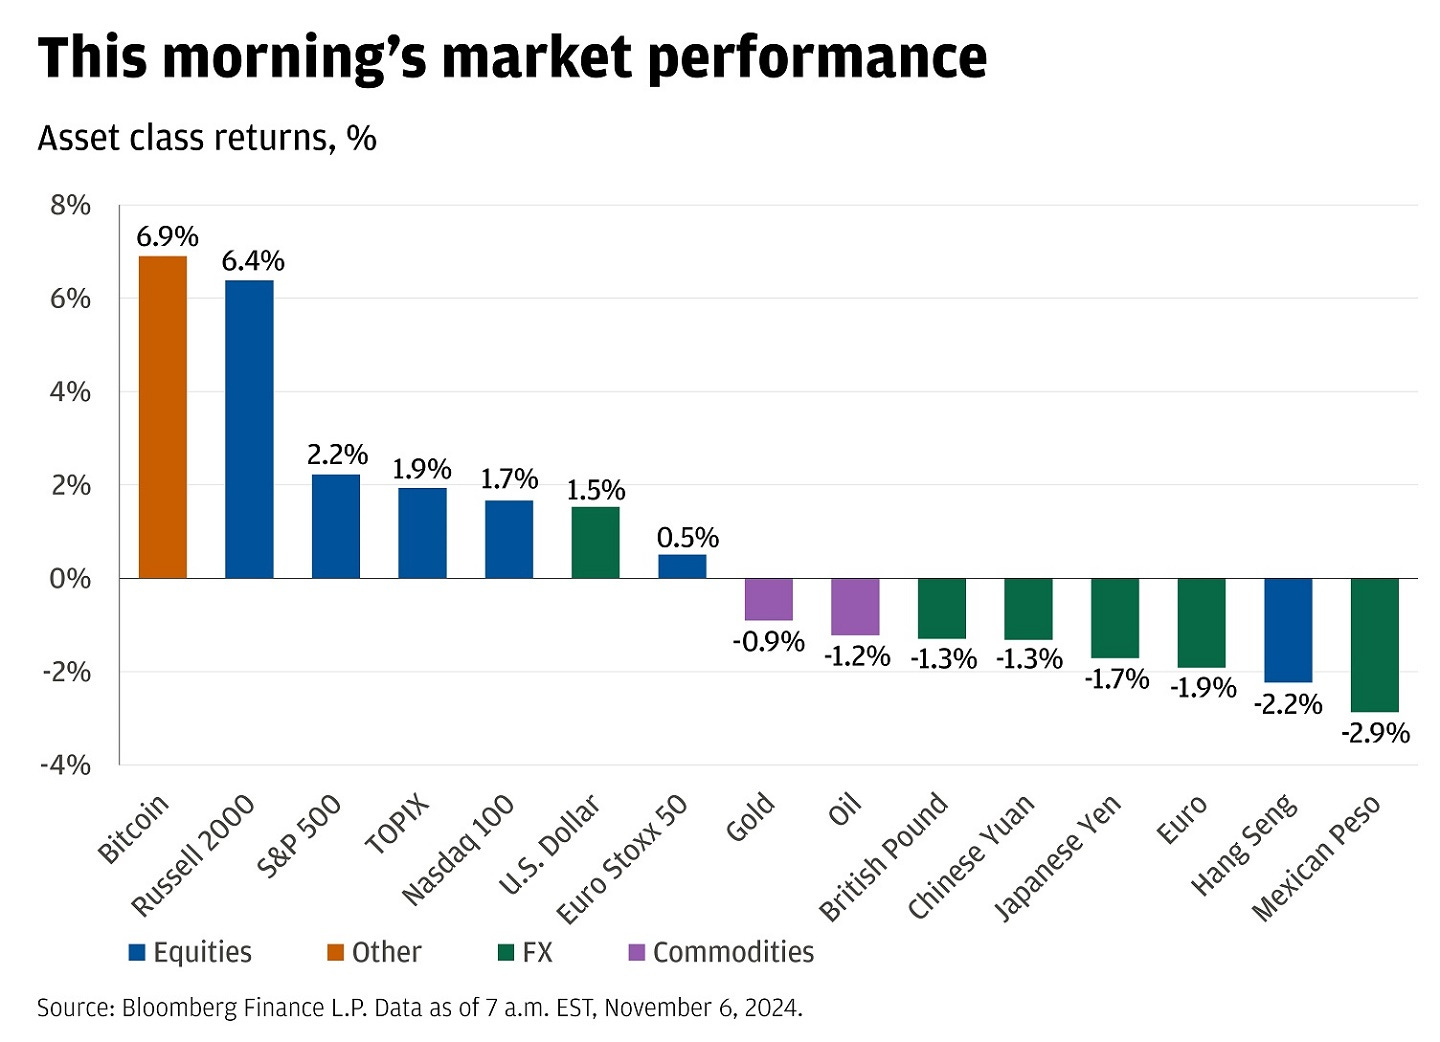
Events such as Presidential elections, Senate confirmations, or Federal Reserve rate decisions have correlation with macroeconomic (undiversifiable) risk i.e. their outcomes impact a broad range of assets in the economy (see screenshot below for market performance post Nov 6 2024). If a candidate's policies are expected to be favorable or unfavorable to financial markets, the election outcome introduces systematic risk that cannot be diversified away.
When an event contract is correlated with the broader market, its price is influenced not just by the fair probability of the outcome but also by how much risk investors are willing to hold. Similarly, if the opposite election contract is negatively correlated with a major asset class, such as equities, investors with large stock exposure may hedge by buying contracts that pay if the less market-friendly candidate wins, pushing the price of the market-friendly candidate’s contract below fair value. This is purely a function of optimizing risk and reward by rational individuals and does not imply a true shift in electoral probabilities.
For a concrete example, consider a case where all investors agree on the true probability pA of Candidate A winning (versus Candidate B). The expected return of the stock market is given by:
The expected return of the event contract:
where πA is the market price of Candidate A's contract. The variance of the portfolio return, given stock weight Ws and contract weight Wc, is:
We optimize mean-variance utility:
The optimal contract weight satisfies the condition that marginal additions / subtraction to the weight produces no utility:
This gives:
Rearranging for market price bias:
The market price of Candidate A's contract is lower than the true probability by:
The underpricing is generally larger when risk aversion is higher, stock exposure is higher, market volatility is higher, or when correlation is perceived as higher.
Generally, when an event contract is correlated with other financial assets, its price movements become ambiguous in meaning. A change in the contract's price could be due to different distinct factors: (1) a real shift in the perceived probability of the outcome (change in "edge"), (2) a change in risk aversion that alters how investors price uncertain outcomes, (3) a change in the perceived correlation between the event and other assets, (4) a change in the perceived risk of other assets.
For example, if traders suddenly believe an election is more correlated with equity markets than previously thought, they may adjust their portfolios accordingly, impacting contract prices without any actual change in the probability of a candidate winning. Similarly, if risk aversion increases due to a macro shock, investors may demand a greater premium for bearing political risk, further distorting market-implied probabilities. This makes it difficult to determine whether observed price changes in event contracts reflect better forecasting or changing market sentiment.
An event contract might appear to be mispriced—trading at a discount relative to its fair probability—but when correlation comes into play, we don’t see the full picture of the positions driving the market. Another trader could be selling implied correlation across multiple event contracts at above 1. In such cases, what looks like an opportunity in a single contract is actually part of a larger portfolio effect, where a trader’s edge comes from managing correlation risk rather than betting on absolute probabilities. When event contracts are interconnected (e.g. election results in different states), trading one contract is implicitly trading its correlation with others, and unless we know the entire web of positions, we may be missing the real reason why the market is priced the way it is.
Forward Pricing & Risk Neutral Probabilities
Event contracts for asset prices often appear to provide probabilities for future outcomes, but their prices are shaped by risk-neutral forward pricing, not necessarily by real-world expectations. This is commonly observed in financial derivatives, where assets with uncertain future payoffs are priced based on arbitrage-free conditions rather than true expected values. Just as equity index options embed a forward price that drifts at the risk-free rate, event contracts are priced under a similar framework that distorts the relationship between observed price and real-world probability.
A clear analogy exists in the stock market: The forward price of a stock index reflects the current spot price adjusted by the risk-free rate, since investors can hedge through arbitrage (borrowing cash at the risk-free rate and buying the underlying). However, in reality, market participants expect long-term stock returns to exceed the risk-free rate due to equity risk premia. If someone were to infer future stock price expectations based purely on forward pricing, they would systematically underestimate expected equity growth. The same logic applies to event contracts on if certain assets (e.g. Bitcoin) will reach certain valuations / remain at certain valuations on specific times in the future. These contracts are priced with a similar no-arbitrage condition.
I have written about this before, but fundamentally derivative pricing under complete markets (where the derivative’s exposure can be dynamically hedged by trading the underlying) is independent of the market expectations of returns and reflects only the cost of hedging and the way risk is priced in the market.
On a somewhat related note, small / big probability events are likely to be significantly mispriced when they are long-dated due to the opportunity cost of capital, as traders discount the value of tying up money in a low/high-probability outcome instead of deploying it in higher-yielding investments, i.e. market participants require additional compensation for illiquidity and opportunity cost as well as risk. As such, it is also necessary to discount the price forward to its expiration by a factor that takes into account the opportunity cost of capital, the illiquidity of the instrument, and the risks of carry (on a decentralized unregulated crypto platform).
When Prediction Markets Work Well
Prediction markets fail to produce true probabilities when structural distortions interfere with price formation. Even assuming rational participants, markets can exhibit systematic biases.
One key failure arises from favorite-longshot bias, which occurs because the equilibrium price of an event contract is not the simple average of participant probabilities but is skewed toward the more extreme probability estimates. This happens because the odds structure creates a nonlinear impact on expected returns—making longshot bets more expensive and favorites slightly undervalued. Thus, even in a market of rational traders, prices deviate from true probabilities.
A second failure stems from risk aversion and correlation with broader financial markets. If an event (e.g., an election outcome) is correlated with macroeconomic variables like stock prices, then the price of the event contract is shaped not only by its expected outcome but also by the market’s willingness to bear the associated risk. For example, a candidate perceived as “market-friendly” may see their contract price suppressed if investors hedge against stock market downside risk by buying the opposing contract. This means prices reflect a combination of true probabilities and compensation for bearing systematic risk, making them unreliable as pure probability estimates.
Another major distortion comes from risk-neutral forward pricing, which is common in financial derivatives. Event contracts—especially those tied to asset price thresholds—are often priced using arbitrage-free conditions rather than real-world expectations. This leads to systematic mispricing, particularly for long-dated contracts, since traders require compensation for tying up capital and bearing illiquidity risks. Small-probability and large-probability events are especially prone to mispricing under these conditions.
Despite these shortcomings, prediction markets tend to work best when:
The event is isolated from broader financial risks (i.e., it has no correlation with macroeconomic assets).
Many traders with diverse views and capital constraints participate, ensuring that no single extreme probability dominates.
Liquidity is deep, so transaction costs and market impact are minimized.
The event is short-term, reducing the effects of time discounting and opportunity cost distortions.
When these conditions are met, prediction market prices may approximate true probabilities.
A Note on Market Efficiency
The notion of market efficiency suggests that it's hard to generate higher expected returns with lower variance by actively trading compared to simply holding broad market assets. This doesn’t mean market-implied probabilities are always correct—it just means that any mispricings are difficult to exploit in a way that offers a superior risk-adjusted return. Even if prediction markets systematically bias probabilities due to factors like favorite-longshot effects or risk aversion, arbitraging those distortions requires capital, patience, and a way to manage variance. Efficiency in this sense doesn’t imply prices always reflect true probabilities, but rather that the cost (time and risk) of correcting errors potentially outweigh the expected profit.
Indeed, markets are not perfect, but they are probably much better at estimating probabilities than any individual person. While market failures can lead to mispricings, these failures do not imply that an average person or even groups of domain experts can systematically do better.
One of the key strengths of markets is that they are not a democracy but instead function as a meritocracy where the best-calibrated beliefs tend to dominate. Unlike a simple survey, where everyone’s opinion is weighted equally, markets allow those with superior insight, resources, and conviction to express their views with more weight. In a public poll, if you ask, "Did humans walk the earth at the same time as dinosaurs?" you may unfortunately get close to a 50/50 split. A democratic system treats all votes equally, meaning that incorrect answers are given just as much weight as correct ones.
However, if you introduce a financial market where a contract pays $100 if the statement is true and $0 if it is false, the price wouldn’t settle at $50 just because of public opinion. Instead, those who are better informed would see an opportunity to profit by selling the contract down to nearly $0, knowing the proposition is false. If they lack enough capital themselves, they can convince or partner with those who have the money to act on this mispricing. Over time, this process drives the price toward an outcome-weighted truth rather than a simple average of public belief.
This illustrates a core strength of markets: they reward correctness rather than popularity. The marginal price is set by those with the best information (typically a small minority) and the highest confidence in their view, rather than by an uninformed majority. Another critical point is that markets, while not infallible, are incredibly difficult to beat over time. Many people assume a market price is irrational when they fail to understand the factors driving it; instead of dismissing strange prices as "stupid," a better approach is to ask: Why is someone willing to pay that price? The existence of seemingly irrational pricing often signals unseen constraints, asymmetric information, or hedges that a casual observer may not appreciate.
Individuals looking to outguess markets must not only be right but must also be right in a way that others aren’t yet willing to bet on. That’s a high bar.
Disclaimer
The information provided on TheLogbook (the "Substack") is strictly for informational and educational purposes only and should not be considered as investment or financial advice. The author is not a licensed financial advisor or tax professional and is not offering any professional services through this Substack. Investing in financial markets involves substantial risk, including possible loss of principal. Past performance is not indicative of future results. The author makes no representations or warranties about the completeness, accuracy, reliability, suitability, or availability of the information provided.
This Substack may contain links to external websites not affiliated with the author, and the accuracy of information on these sites is not guaranteed. Nothing contained in this Substack constitutes a solicitation, recommendation, endorsement, or offer to buy or sell any securities or other financial instruments. Always seek the advice of a qualified financial advisor before making any investment decisions.
Great post! Am confused by this because I would’ve assumed long-shot bias would mean people favour the underdog disproportionately? For example in your 85-95 example, if true probability is 90, I would assume that people would irrationally bet in favour of the less-likely outcome and so the event contract would be oversold (I.e price is below 90). Your maths seems to suggest prices skew in favour of the favourite not the underdog.