
Optimal Tick Size
Tick Sizes are a Multi-Dimension Trade-Off

It seems there is an optimal tick size somewhere between 1 and 4 ticks wide. Optimal tick sizes can make markets more efficient, more liquid, and boost stock valuations. As a corollary, decentralized AMM curves which effectively have infinitely small tick sizes are suboptimal. Research drawn from NASDAQ Market Infrastructure Research.
Tick Sizes are a Trade-Off
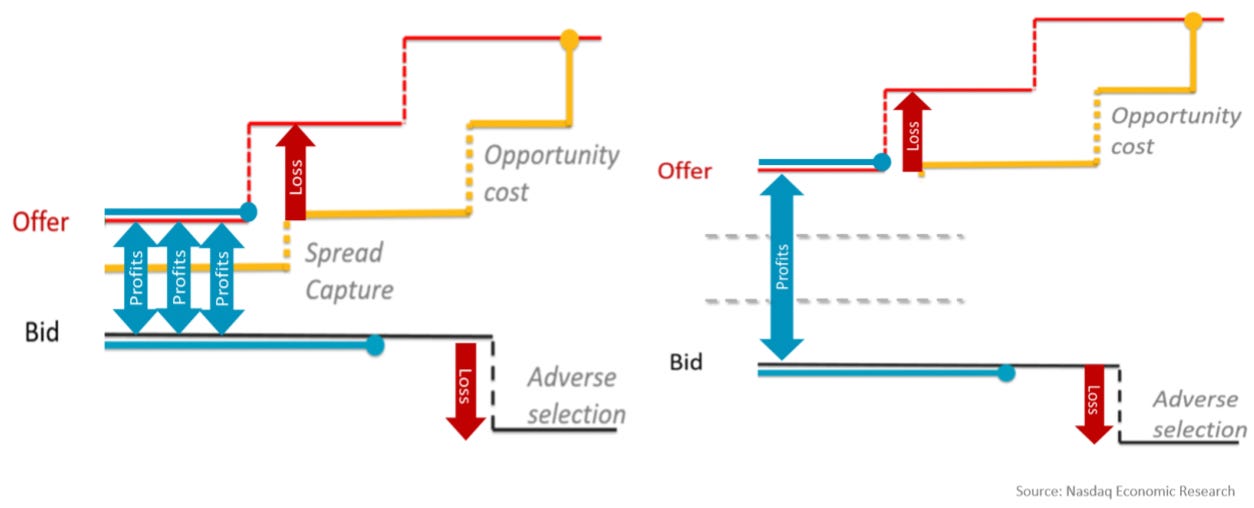
One way to think about liquidity provision is that it is a balancing act between earning the bid-ask spread and losing due to adverse selection. A theoretical paper shows that under certain assumptions, a 1 tick spread balances spread capture and adverse selection. Assuming that the dollar value (e.g. 1 cent) of tick sizes are set, this implies that firms should split / reverse-split their stocks such that at equilibrium their stocks trades around 1 tick wide on exchanges.
In percentage terms to the stock, the equilibrium spread will be determined by multiple factors. If a stock trades with a mix of buyers and sellers (left chart), it is possible for a market maker to capture multiple spreads before incurring adverse selection. Ultimately, for tick-constrained stocks, the attraction of likely spread capture results in much longer queues. If a stock rarely trades (right chart), a stock will trade multiple ticks wide so that the spread can offset the less noisy (more informed) order flow. This explains why less-liquid stocks always have wider spreads in, but it also highlights that smaller ticks on their own won’t make spread any tighter.
Smaller Tick Size Reduces Spread and Depth
Good market design should balance the trade-off between minimizing the quoted spread and depth. A smaller tick is typically seen as beneficial to retail investors, since it reduces the spread transaction cost, but worse for larger institutional investors, who may see more impact cost as they work their larger orders in thinner markets.
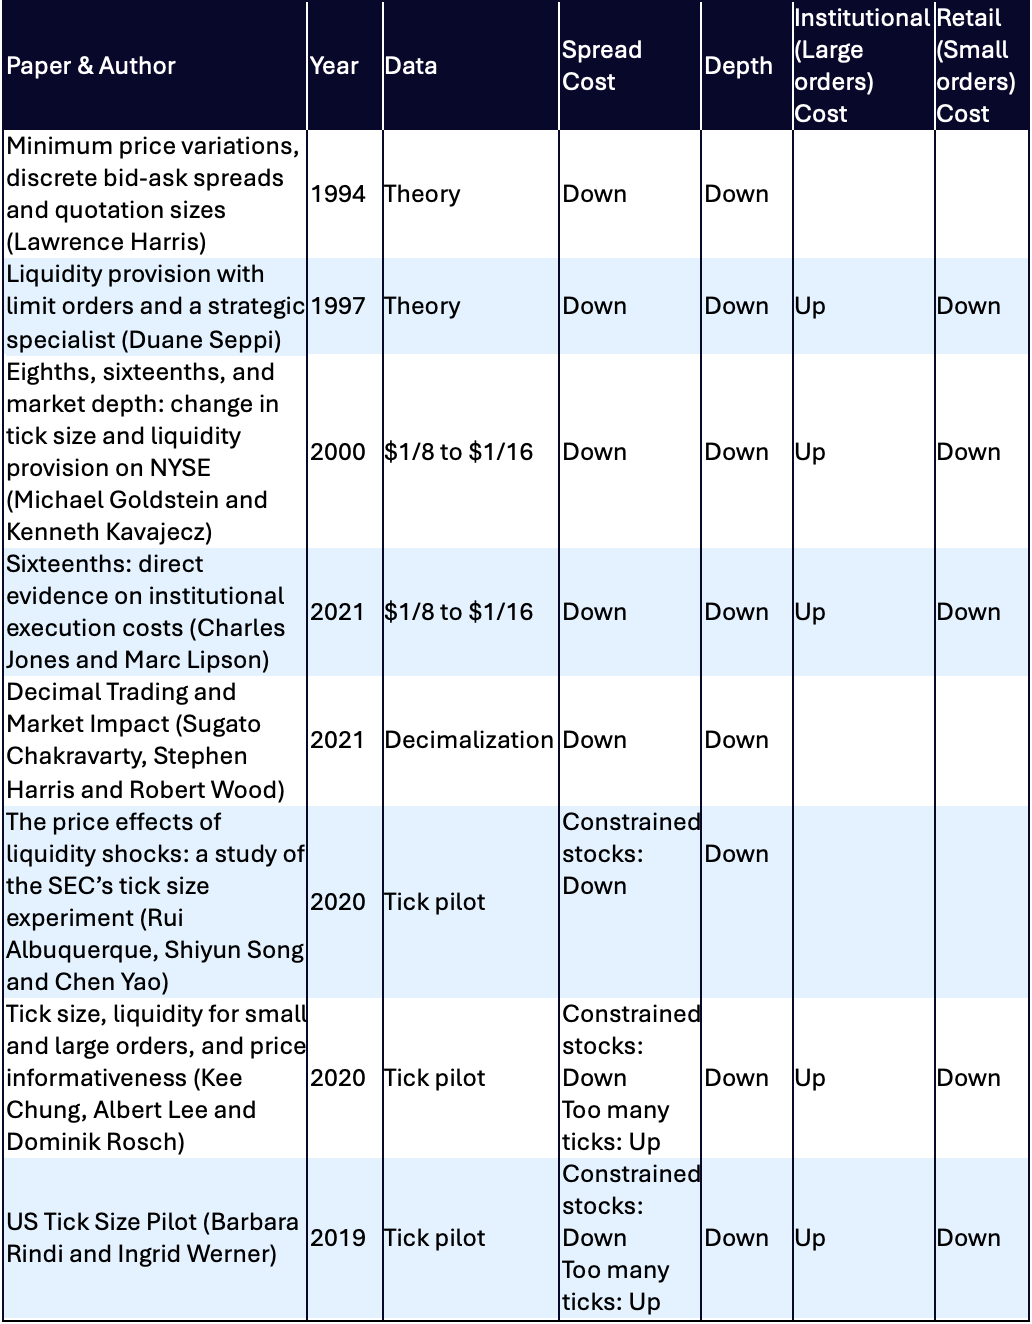
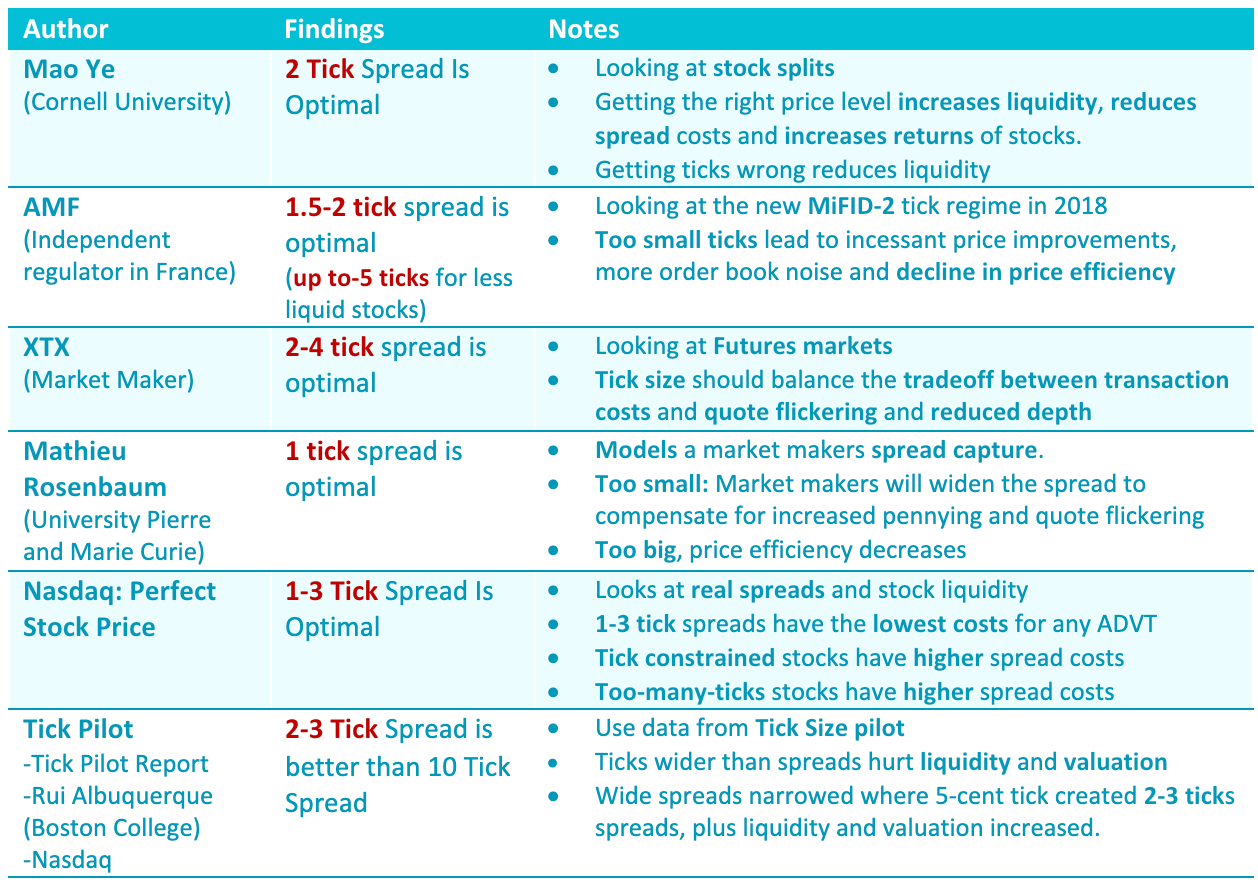
Empirically Tick Sizes are Optimized at 1.5-4.5 Ticks
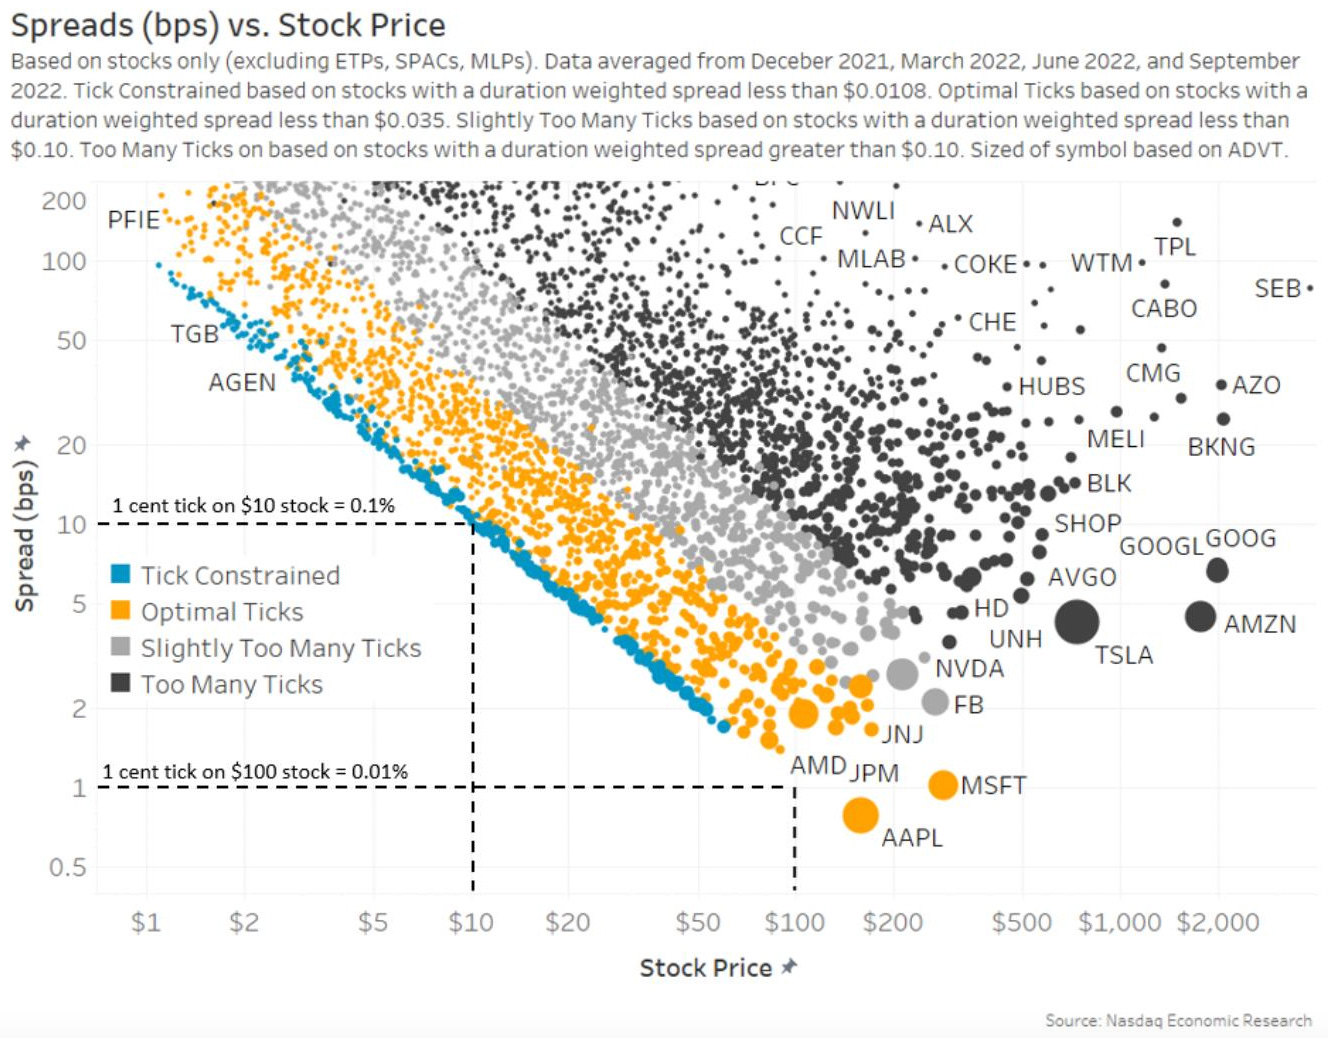
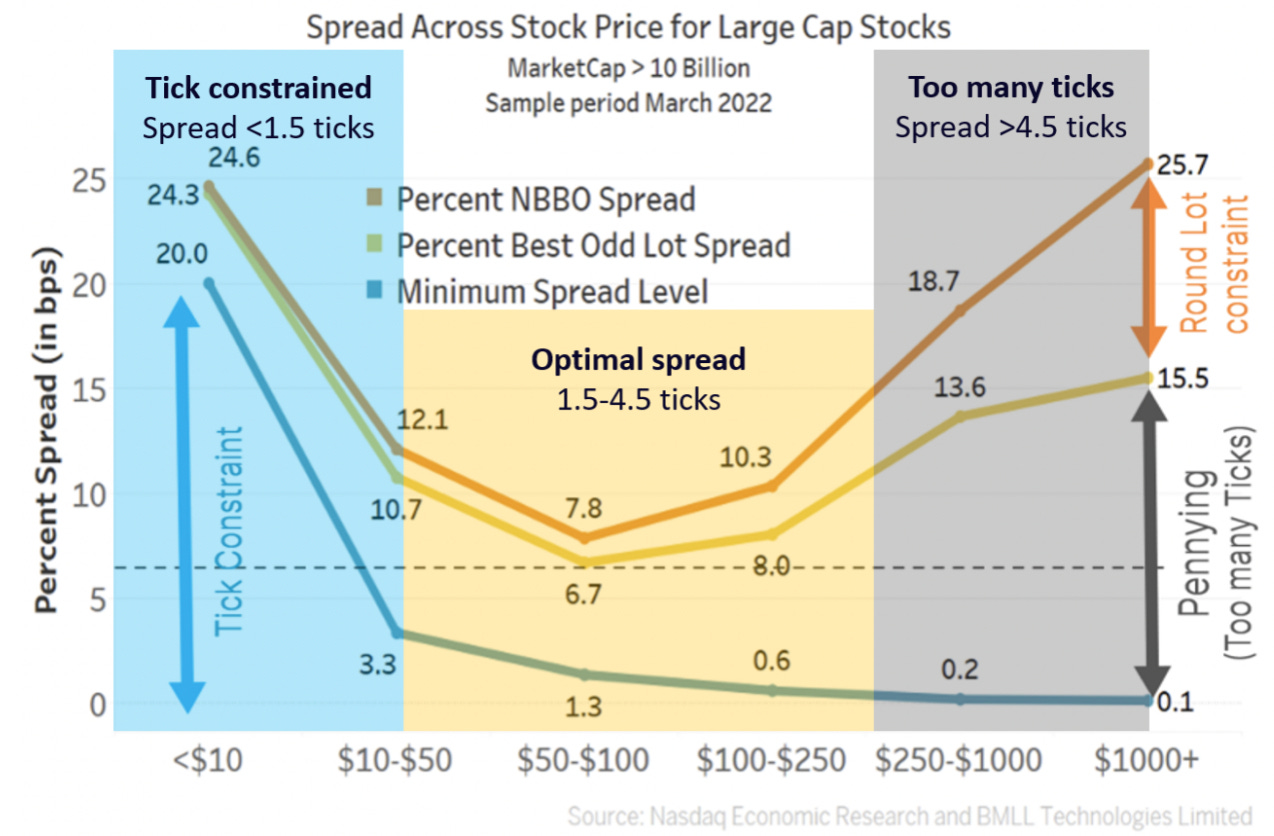
At any stock price, there are stocks that are tick constrained (blue dots) and have too many ticks (black dots). Spreads naturally form a U, where even though ticks get incrementally smaller as stock prices keep rising (blue line), the spreads actually fall first and then increase once you have too many ticks inside the NBBO (orange line) even if we remove the round lot constraint (yellow line).
Microstructure Considerations Regarding Round / Odd Lots
Almost all stocks in the U.S. also have a concept of a “round lot,” which is 100 shares. Historically that was designed to reduce paperwork on settlement and also ensure that benchmark spread prices reflected a meaningful trade value.
Round lots are the prices the public see; they set the official spread that institutional investors use to compute trading costs, and they are “protected,” which means traders cannot skip over them to trade elsewhere (including off exchange). In contrast, odd lots are neither visible nor protected on the consolidated data feed.
That can increase costs for large buyers in two ways: (1) buyers trading off-exchange could trade at worse prices than available odd lot orders on exchange and (2) some institutional buyers using algorithms might miss odd lot liquidity on purpose. That’s because research suggests filling odd lot orders give away too much information.
Round lots can also artificially widen spreads. The value of a round lot increases as price increases. Supply and demand is typically the same regardless of tick size. However, when the stock in the upper chart is split 10:1, the 50-share ($50,000) odd lots become round lots, automatically adding to the official quote and cutting the spread for the $100 stock in the lower chart in half.
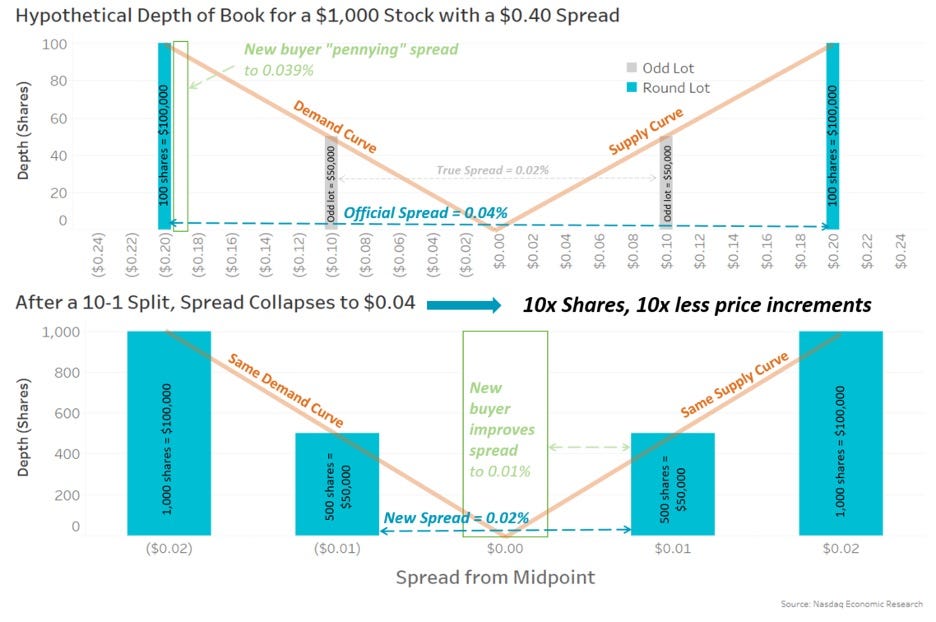
The upper chart shows that ticks on a $1,000 stock are worth just 0.001%. Even the most liquid companies in the U.S. markets have a spread closer to 0.01%. All those increments reduce the cost of jumping in front of (i.e. pennying) buyers already in line (new buyer = green box). That penalizes the original buyer, who may miss fills, without really improving prices for those wanting to sell or reported spreads.
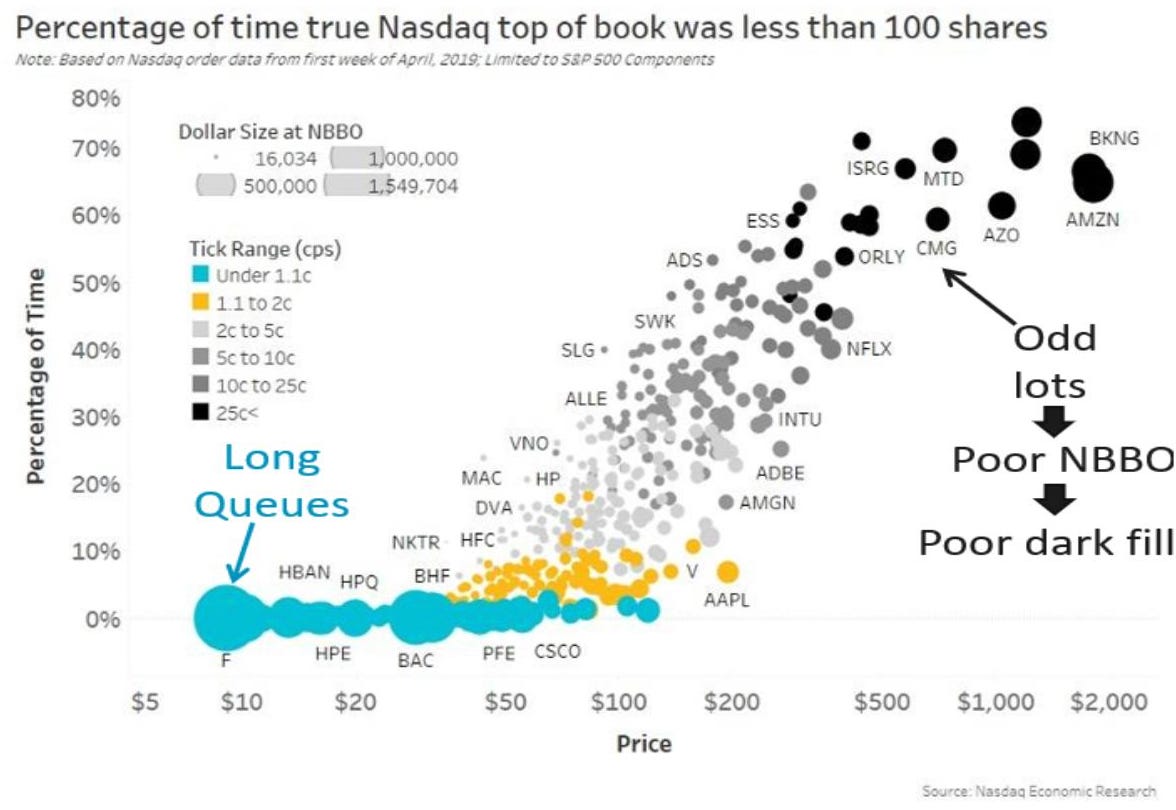
With larger increments and smaller round lot, an investor looking to bid ahead of existing buyers now needs to materially improve the spread (green box), and materially tightening the spread for sellers. In fact, stocks trading with spreads around 1-2 ticks wide generally have relatively low levels of odd lots inside the official quote.
However, as prices climb, so too does the number of ticks between the bid and offer (black dots) and the probability that the true best bid and offer is an odd lot (diagonal slope of the grey dots). This also shows that the higher the stock price the worse the odd lot problem becomes.
Different Tradability Problems For Low / High Tick Stocks
Tick-constrained stocks (blue dots below) see the 1-cent tick itself become more expensive as prices fall (diagonal line in the Spreads vs. Stock Price chart). That, in turn, causes investors to queue for longer (larger blue circles below), increasing opportunity costs (wait times) for posting. This adds to hidden order usage, reducing transparency and increasing liquidity search costs.
Too-many-tick stocks, instead, typically have higher prices, which makes the tick costs much lower but makes a 100-share round lot larger. Market makers demand more return (spread) to commit more capital (depth), so it makes sense that the NBBO spread widens because of the round lot constraint.
However, we also see an increasingly high proportion of odd lots using all the micro ticks inside the NBBO (itself a problem, making the NBBO artificially wide, which potentially also increases costs of dark-pool fills that are pegged to NBBO prices). However, even looking at the best odd-BBO, spreads widen, highlighting that too many ticks actually makes spreads worse, not better.
Splits Help High Tick Stocks Trade Higher
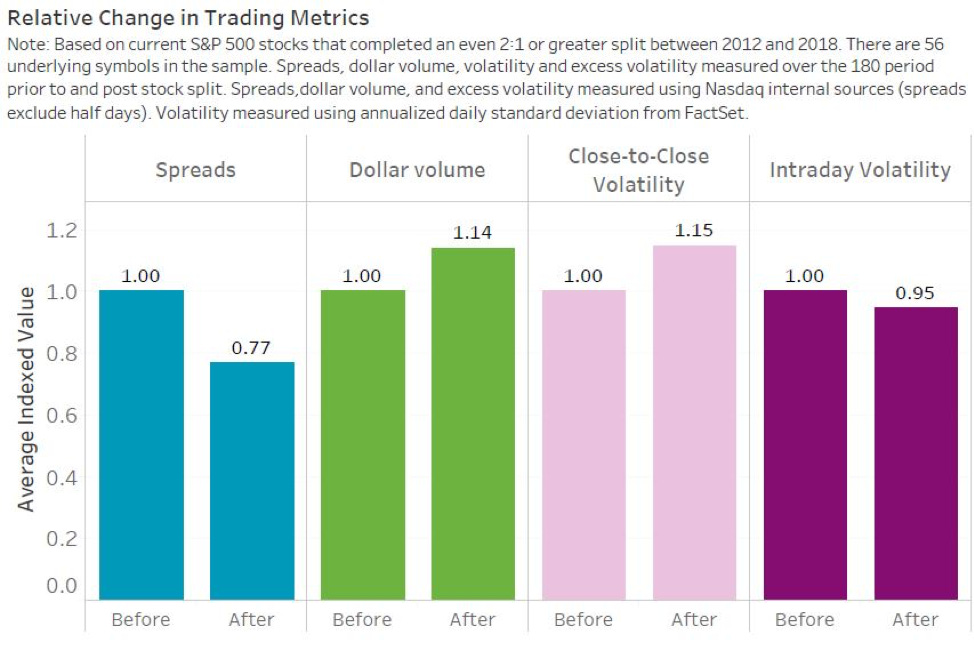
Splitting / reverse-splitting fundamentally changes how stocks trade. It makes it cheaper for investors; in turn, stock valuations should be permanently higher as a consequence of the reduced cost of equity. Academic research shows that stocks that split tend to outperform the market.
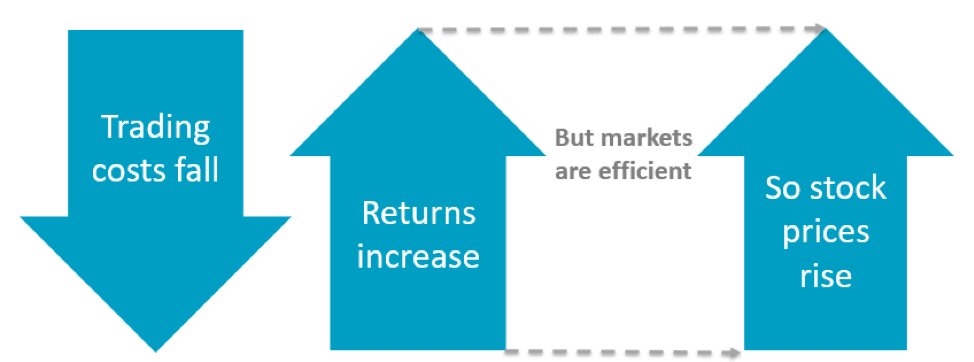
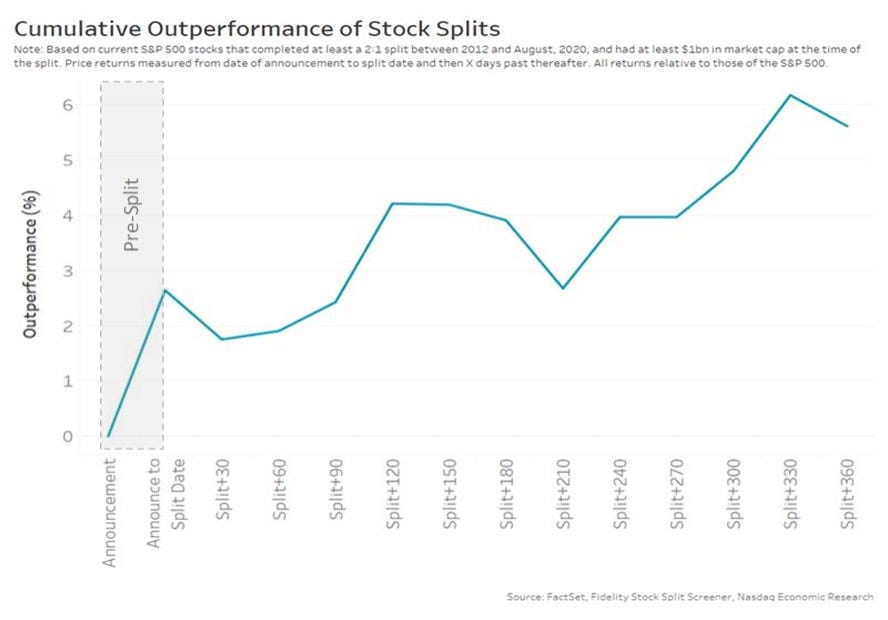
Overall, large cap stocks that split outperform the market by an average of 5% over the next 12 months. Just announcing a split causes the average stocks to outperform the market by 2.5%, indicating the market expected gains even before tradability improves. Liquidity improvements following stock splits reduced average companies cost of equity capital by 17.3%, or 2.4 percentage-points per-annum. This is a material boost to both issuers and investors.
Most Stocks Can Benefit From Splitting
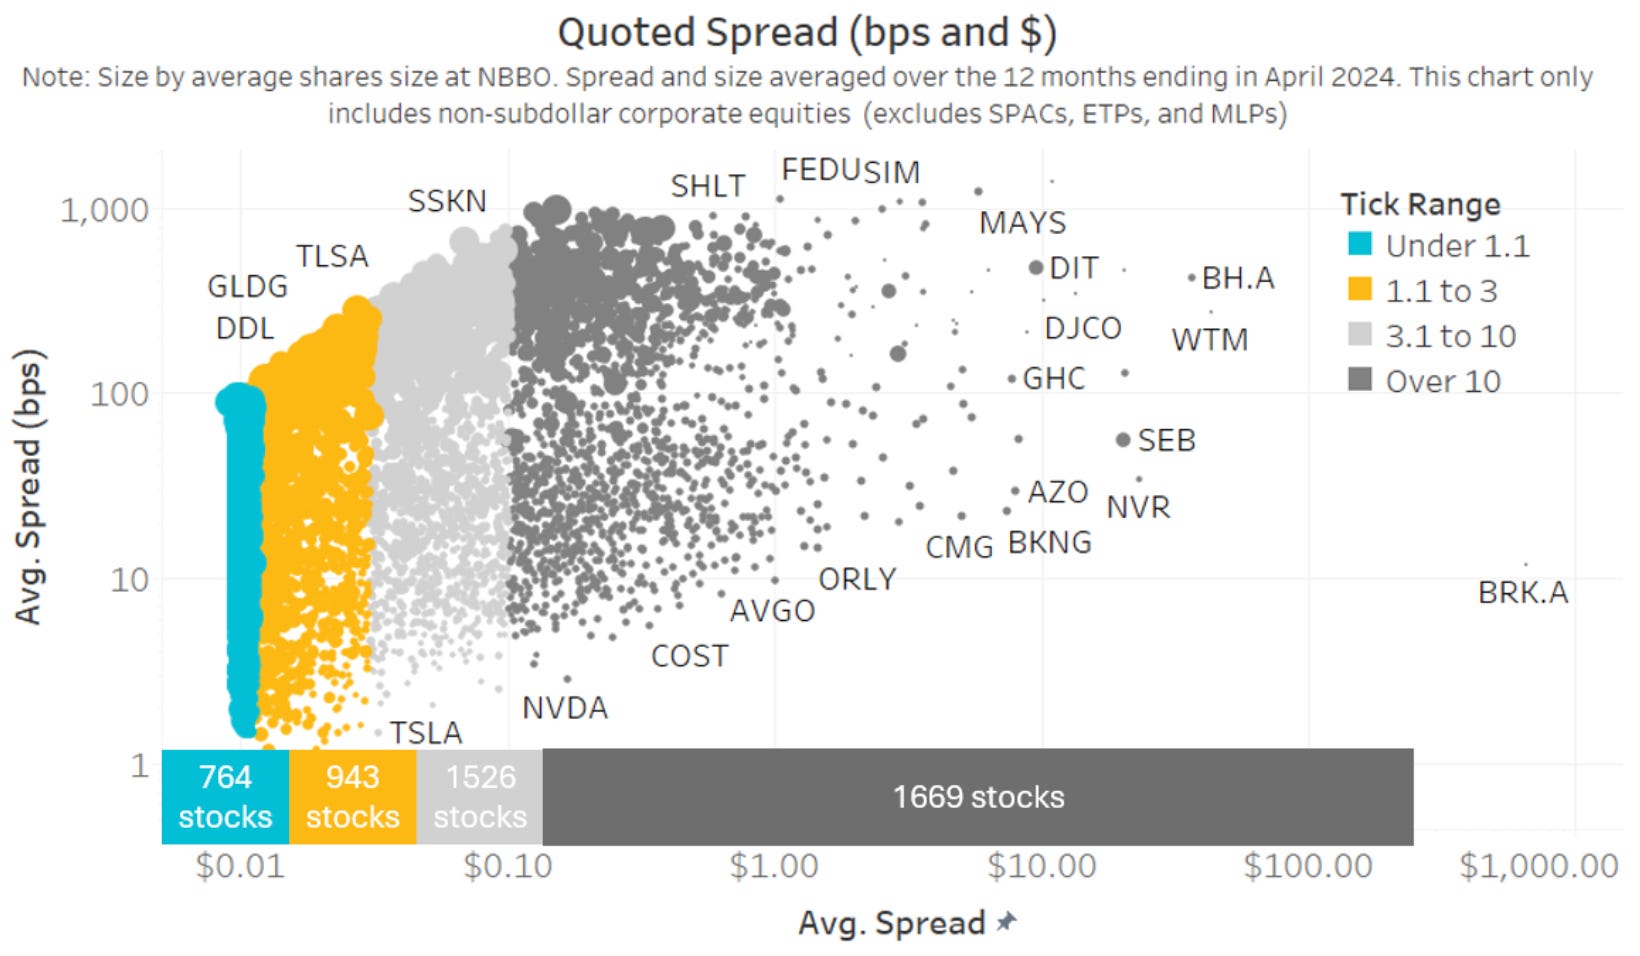
About 764 stocks are tick constrained (blue group), which would benefit from a tick size reduction. About 943 stocks are optimally ticked (yellow group), of which the current tick size is optimal. About 1,526 stocks are slightly over ticked (light grey). They could benefit from a small tick size increase, although the benefit may not be worth the complexity. About 1,669 stocks have too many ticks (dark grey). They would benefit from a tick size increase.
Disclaimer
The information provided on TheLogbook (the “Substack”) is strictly for informational and educational purposes only and should not be considered as investment or financial advice. The author is not a licensed financial advisor or tax professional and is not offering any professional services through this Substack. Investing in financial markets involves substantial risk, including possible loss of principal. Past performance is not indicative of future results. The author makes no representations or warranties about the completeness, accuracy, reliability, suitability, or availability of the information provided.
This Substack may contain links to external websites not affiliated with the author, and the accuracy of information on these sites is not guaranteed. Nothing contained in this Substack constitutes a solicitation, recommendation, endorsement, or offer to buy or sell any securities or other financial instruments. Always seek the advice of a qualified financial advisor before making any investment decisions.