
Options Path-Dependency
Heuristics About Realized Volatility From Delta Hedging

Notes from JP Morgan European Equity Derivatives Strategy 17 November 2006 page 77-78.
Can volatility be “captured” by delta-hedging?
Conventional trading wisdom says that if you buy an option, delta-hedge it continuously, then you’ll earn money whenever realised volatility ends up above the implied volatility you paid. This is true but only under a very clean set of assumptions: realised volatility is constant and you hedge in infinitesimally small time steps. But that neat rule hides some crucial path-dependent nuances that matter a lot in practice. Two in particular:
Where the volatility shows up matters.
The magnitude of your P/L doesn’t just depend on the gap between implied and realised volatility. It also depends on where the underlying spends its time. If the underlying trades near the strike, especially close to expiry when gamma is high, the absolute value of your hedging P/L (positive or negative) will be larger.When the volatility shows up matters.
When volatility varies over time, the portions of the path with elevated variance only help you if you have meaningful dollar gamma at those times and prices. Differences between implied and realised volatility contribute much more when the underlying is near the strike, particularly into expiry.
Put bluntly: with non-constant volatility it’s perfectly possible to buy and delta-hedge an option at an implied vol below what’s ultimately realised and still lose money. The path can beat the average.
A concrete case: 1-year Euro Stoxx 50 options (Nov 2001 → Nov 2002)
Start date: 1 Nov 2001
Expiry: 1 Nov 2002 (1-year option)
Index level at inception: 3500
ATM implied vol at inception: 28.5%
Full-year realised volatility: 36%
Path of the underlying and realised vol: From November 2001 through May 2002, the index mostly ranged 3500–3800, realising about 20% volatility. After May, the index fell rapidly toward ~2500, realising ~50% volatility along the way.
2500-strike put (out-of-the-money below spot at inception)
Purchase vol: 33.4% (above the 28.5% ATM due to put skew).
Early period: With the index far from 2500 and realised vol ~20%, the position lost money, but gamma was low that far OTM, so losses stayed modest. Later sell-off: As the index sold off toward 2500, gamma rose sharply and realised vol spiked. The hedge finally had the “right” kind of exposure at the “right” time.
Outcome: +120 index points (ip) of P/L, roughly +18 vegas.
4000-strike call (out-of-the-money above spot at inception)
Purchase vol: 26% (10 vol points below what would later be realised over the year).
Early period: This option started with much higher gamma than the 2500-strike. In the low-vol, range-bound months, that higher gamma translated into larger hedging losses. Later sell-off: When high volatility finally arrived, it happened well away from the 4000 strike. Dollar gamma by then was low, so the hedge couldn’t monetise the violent moves.
Outcome: –60 ip of P/L, about –5 vegas, despite the option having been purchased at 26% implied vs 36% realised for the year.
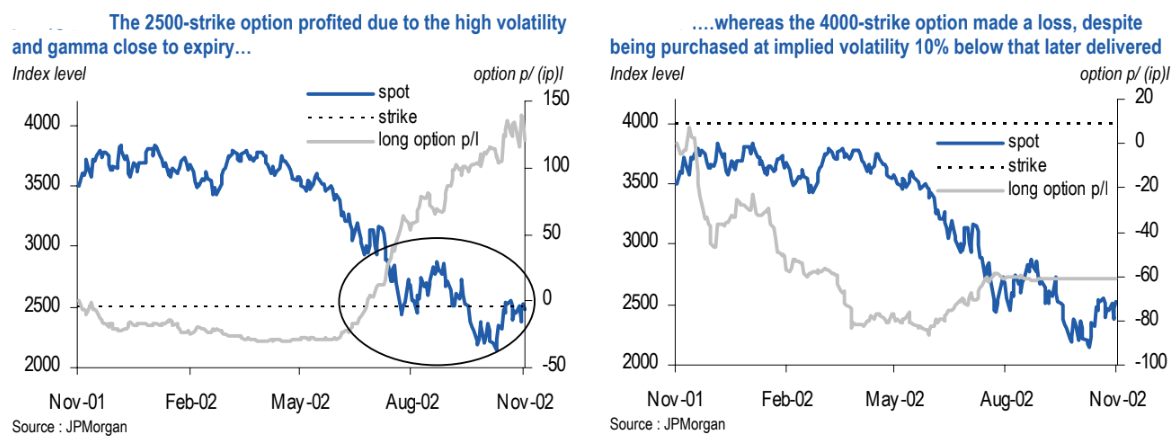
Interpretation: The 2500-strike profited because elevated variance occurred as the underlying approached the strike, late in the life when gamma was largest. The 4000-strike struggled because realised variance materialised far from its strike, leaving little gamma to harvest it.
How delta-hedging P/L actually accrues
For a delta-hedged option, the mark-to-market P/L can be thought of as a (typically daily) accrual from the gap between realised variance and the implied variance you paid, scaled by the time step. Crucially, each day’s contribution is weighted by current dollar gamma. Because dollar gamma depends on where you are on the path, spot vs strike, time to expiry, and skew, this weighting is inherently unpredictable.
Your sensitivity to the realised–implied variance spread is not constant through the life of the trade; it moves with dollar gamma. When does the variance “count” most? When dollar gamma is high. If you are ATM then you get high exposure to the realised–implied spread while the underlying stays near the initial level; if you are OTM then you get minimal exposure until the underlying trades near the strike.
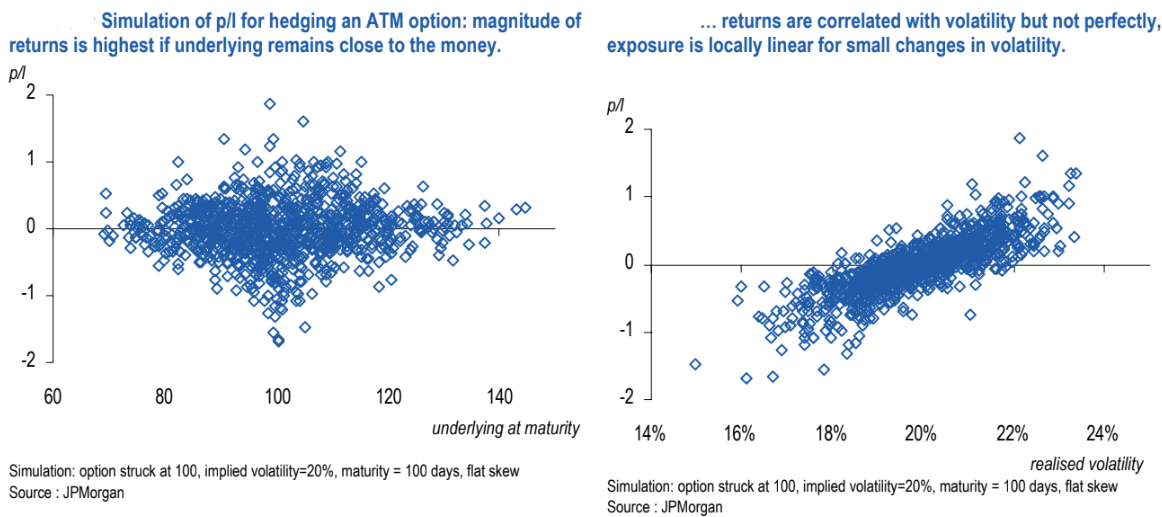
Simulations: how path location shapes hedging P/L
Assume flat skew, 100-day maturity, and 20% implied volatility.
Setup: Strike = 100, IV = 20%, maturity = 100 days, flat skew.
Observation: The magnitude of hedging returns is highest if the underlying finishes close to the money.
Vol sensitivity: Returns are correlated with realised volatility but not perfectly so; for small changes in vol, exposure is locally linear.

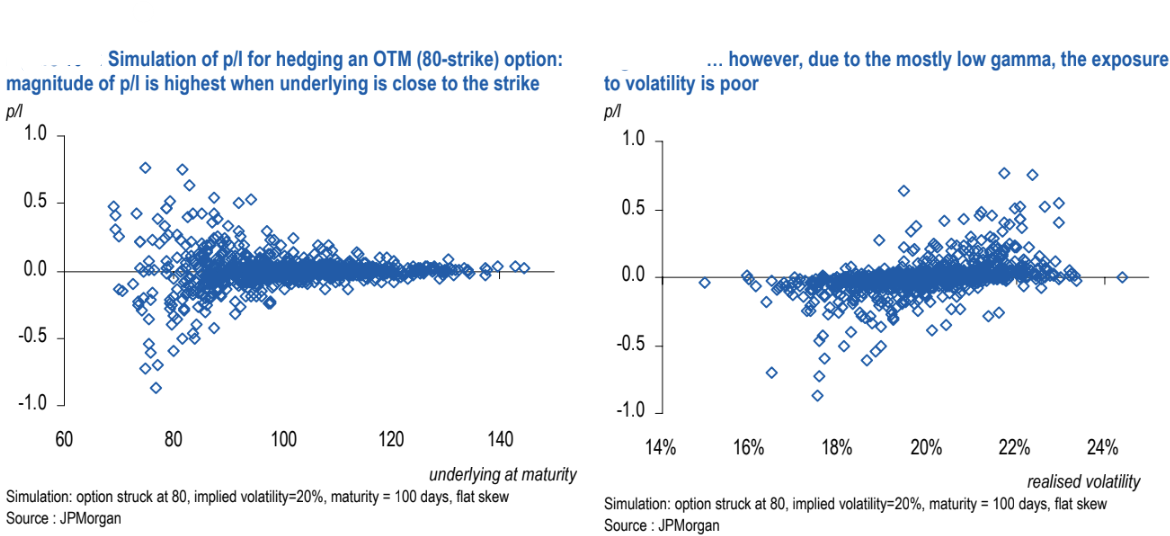
Setup: Strike = 80, IV = 20%, maturity = 100 days, flat skew.
Observation: Hedging P/L is largest when the underlying ends up near 80—i.e., when the path spends time near the strike.
But overall exposure to vol is weak: Because the option spends most of its life with low gamma, the aggregate sensitivity to realised volatility is poor.
The punchline
Yes, the P/L of a delta-hedged option generally depends on the spread between the squared implied volatility you purchased and the squared volatility subsequently realised.
The dependence is strong when the underlying trades near the strike, especially as expiry approaches and gamma swells.
Sensitivity tails off quickly as spot moves away from the strike. When you don’t have dollar gamma, you don’t have meaningful exposure to realised variance—even if realised vol is huge in the aggregate.
Dollar gamma explains everything. If an instrument existed whose dollar gamma stayed constant over time and across spot moves, then your exposure to realised vs implied volatility would be constant. Options don’t have that property; their gamma is inherently path-dependent.
Disclaimer
The information provided on TheLogbook (the "Substack") is strictly for informational and educational purposes only and should not be considered as investment or financial advice. The author is not a licensed financial advisor or tax professional and is not offering any professional services through this Substack. Investing in financial markets involves substantial risk, including possible loss of principal. Past performance is not indicative of future results. The author makes no representations or warranties about the completeness, accuracy, reliability, suitability, or availability of the information provided.
This Substack may contain links to external websites not affiliated with the author, and the accuracy of information on these sites is not guaranteed. Nothing contained in this Substack constitutes a solicitation, recommendation, endorsement, or offer to buy or sell any securities or other financial instruments. Always seek the advice of a qualified financial advisor before making any investment decisions.