
Post-Earnings-Announcement Drift
Review of PEAD and the Broader Logic of Trading Headlines

We review the accumulated evidence on post-earnings-announcement drift, or PEAD, and then places that literature inside the wider family of delayed-reaction and momentum effects that motivate trading headlines. The central conclusion of the literature is no longer merely that prices drift after earnings surprises. It is that prices drift most when news is difficult to interpret, when investors do not fully map current disclosures into future cash flows and earnings, when attention is fragmented, and when arbitrage is costly or risky.
The most convincing modern reading of the evidence is therefore an interaction story: information quality, investor processing, and market frictions jointly determine how quickly public news gets reflected in price.
Classic PEAD
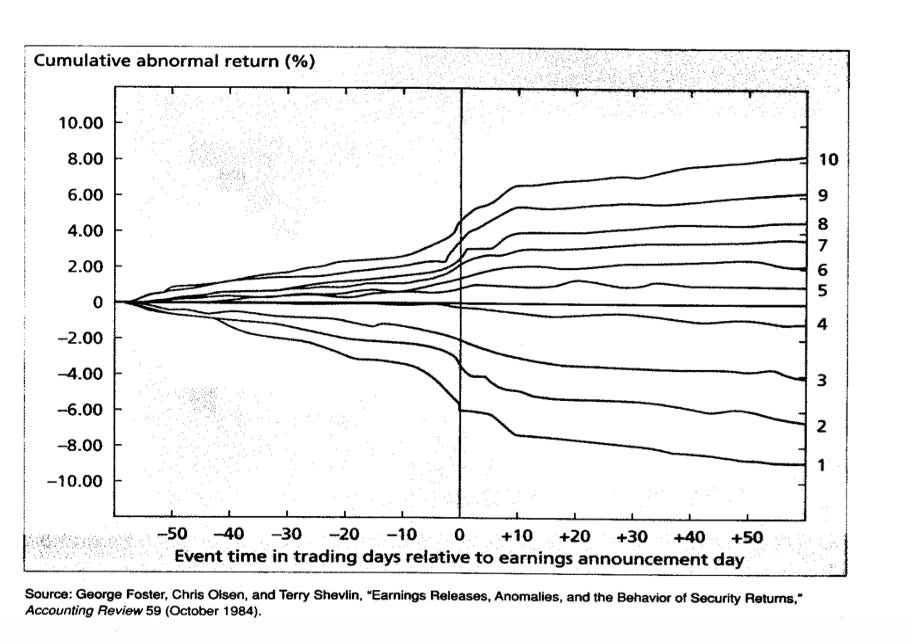
In 1968, Ray Ball and Philip Brown published a An Empirical Evaluation of Accounting Income Numbers showing that after the announcement, prices kept moving in the direction of the surprise. Not a lot. Not instantly. Just a slow, persistent drift, upward for good news, downward for bad, that continued for at least 60 days. This was the first documentation of post-earnings-announcement drift (PEAD), and it became one of the most replicated anomalies in all of empirical finance.
Victor Bernard and Jacob Thomas sharpened the finding across two landmark papers in 1989 and 1990. Using data from 1974 to 1986, they showed that the spread in average returns between stocks in the top and bottom deciles of standardized unexpected earnings (SUE) was positive in 41 of the 48 quarters in their sample.
The magnitudes were large. Bernard and Thomas (1990) found that zero-investment portfolios formed on SUE deciles generated abnormal returns of approximately 8–9% per quarter, roughly 35% annualized before transaction costs. Later studies have documented the range of annual PEAD returns between roughly 8.76% and 43.08%, depending on sample period and methodology.
A particularly striking feature was that about 25–30% of the total post-announcement drift was concentrated in just the three-day windows surrounding the next quarterly earnings announcements, despite those windows representing only about 5% of total trading days, suggesting that the drift wasn’t random but instead had a structure.
They documented that quarterly earnings follow a systematic autocorrelation pattern. Seasonal differences in earnings (comparing the same quarter year-over-year) show positive autocorrelations for the first three lags that decline in magnitude , approximately 0.34 at lag one, 0.19 at lag two, and 0.06 at lag three. In other words, if a company beats earnings this quarter, it will probably beat the next three quarters too (by shrinking amounts).
Bernard and Thomas concluded that PEAD occurs because investors fail “to recognize fully the implications of current earnings for future earnings.”
This is important because it reframes PEAD not as a market plumbing problem but as a reading comprehension problem. The information is public. The pattern is stable. But parsing its implications in real time, across hundreds of firms, is hard cognitive work. And that work is where the drift comes from.
Complexity Increases Delayed Reaction
If the core issue is interpretation difficulty, then anything that makes interpretation harder should make the drift larger. The empirical evidence strongly supports this.
Attention Scarcity: Hirshleifer, Lim, and Teoh (2009) tested the investor distraction hypothesis directly. On days when many firms announce earnings simultaneously, the immediate price reaction to any single firm is weaker and the subsequent drift is stronger. Even purely public information gets systematically mispriced when there is simply too much of it arriving at once.
Delayed Disclosure: Li, Nekrasov, and Teoh (2020) found that when companies delay full financial-statement disclosure until their 10-Q filing (rather than including it in the initial earnings announcement), the drift increases dramatically. Moving from zero to full delayed disclosure corresponds to approximately a 37% decrease in the immediate earnings response and a 42% increase in PEAD.
Limits to Arbitrage: Research documents that PEAD is consistently more pronounced for stocks with higher transaction costs (wider bid-ask spreads), lower share prices and trading volume, lower institutional ownership, less analyst coverage, and higher idiosyncratic volatility. In other words: the harder a stock is to analyze and trade, the longer the drift persists.
Risk-Based Explanations
Not everyone agrees PEAD is purely behavioral. Risk-based explanations suggest the drift is compensation for bearing some form of underlying risk. In particular, it is true that the log price-dividend ratio is convex with respect to expected growth rates. This convexity implies that stock returns are more sensitively affected by changes in expected growth when expected growth is higher.
Classic PEAD Fades
The magnitude of classic numerical PEAD has declined substantially over time. The spread in average returns between high- and low-SUE portfolios fell from about 5% in the 1980s/1990s to 3% or lower by the late 2010s. Charles Martineau (2022), in a paper provocatively titled Rest in Peace Post-Earnings Announcement Drift, showed that PEAD began disappearing from non-microcap stocks around 2001 and was essentially zero for large-cap stocks by 2006.
The causes are structural: decimalization made electronic arbitrage more precise; Reg NMS in 2005 accelerated high-frequency trading; prices began fully adjusting on announcement day. The Sarbanes-Oxley Act (SOX) also played a role; post-SOX, market reactions show faster immediate adjustment and lower abnormal returns in the +2 to +60 day window, consistent with improved financial reporting quality, stronger audit committees, and CEO/CFO certification requirements.
Kettell, McInnis, and Zhao (2022) add an important nuance: declining earnings persistence is itself a key driver. The persistence of SUE has fallen over time, and after controlling for this, the declining trend in PEAD becomes statistically insignificant. In other words, part of the reason PEAD shrank is that earnings surprises became less predictive of future earnings.
Complex PEAD Remains
Meursault, Liang, Routledge, and Scanlon, in a Philadelphia Fed Working Paper titled PEAD.txt, constructed a purely text-based analogue of the earnings surprise. Their measure, SUE.txt, is derived entirely from earnings-call language, without using the reported earnings number at all.
The result was that SUE.txt generates a larger post-announcement drift than classic numerical PEAD at every calendar-quarter mark. The PEAD.txt portfolio generates larger alpha than the traditional PEAD portfolio within the Fama-French five-factor-plus-momentum framework, and remains economically significant in recent years when classic PEAD is close to zero.
The researchers note that text and numbers “compress primitive data in different ways and are neither completely orthogonal nor identical.” The meaningful distinction isn’t between different types of information, but rather it’s between structured and unstructured form.
The easy, numbers-based underreaction got competed away first. The harder, language-based underreaction survived. That’s exactly what you’d expect if the bottleneck is interpretation of messy information, not access to data.
From Quarterly Earnings to the Entire Internet
PEAD was the scheduled, quarterly, single-number version of a much more general phenomenon: markets are slow readers. The empirical record now tells a clear story:
1. Public information that is easy to parse (a single EPS number) eventually gets priced efficiently once markets mature, infrastructure improves, and arbitrageurs target it.
2. Public information that is hard to parse, unstructured text, fragmented signals, complex context, continues to generate persistent drift even in today’s markets.
3. Anything that increases interpretation difficulty, distraction, delayed disclosure, illiquidity, low analyst coverage, high idiosyncratic volatility, amplifies the drift.
4. AI systems can already extract predictive signal from both text and visual representations of earnings data, often outperforming human analysts.
Now we generalize. The world doesn’t hand traders a neat quarterly EPS surprise every 90 days. It hands them screenshots on X, rumors in Telegram groups, app-store rankings, GitHub commits, and offhand comments in podcasts. Each of these is an information event. Each one has a “surprise” component.
Onchain Markets & Delayed-Reaction Effects
The PEAD literature gives us a precise checklist of conditions that make drift worse:
Lower liquidity ✓ Lower institutional ownership ✓ Less analyst coverage ✓ Higher volatility ✓ Greater information asymmetry ✓
Liquidity is bad. Most prediction markets, equity perps, and tokens trade with a fraction of the depth of even a small-cap U.S. equity. Thin order books are the single strongest predictor of persistent post-announcement drift in the academic record.
Price reaction is delayed by design. Equity perp oracles must bridge the gap between TradFi trading sessions and 24/7 onchain availability. When external price feeds go dark, oracles fall back on internal smoothing mechanisms, exponentially weighted moving averages of their own order flow. That is a structural lag baked into the market.
There is virtually no institutional ownership. The largest allocators, such as pensions, endowments, sovereign wealth funds, the multi-strat hedge funds, are almost entirely absent from onchain markets. The PEAD literature is explicit that low institutional ownership is one of the strongest correlates of persistent drift These are retail-dominated venues.
Analyst coverage is near zero. No sell-side research desk publishes models on DeFi assets. The limits-to-arbitrage research shows that less analyst coverage means slower information incorporation and larger drift.
Idiosyncratic platform risk is high. Oracle failures, smart-contract exploits, governance attacks, depegs, bridge hacks; these are platform-specific risks with no analogue in traditional equity markets. High idiosyncratic risk is another condition the literature directly associates with stronger PEAD.
Information asymmetry is extreme. Many onchain assets have no mandatory disclosure, no standardized reporting, and no audited financials. The information that moves prices is fragmented, unstructured, and unevenly distributed.
These are not bugs to be fixed before onchain markets “mature.” They are the current reality, and they describe an environment where PEAD-style logic, slow reading, persistent mispricing, exploitable drift, should be at its most alive. These markets don’t need less drift. They need better readers.
The Application of AI
Historically, the ability to read raw information, form a view, and express it in a market belonged to hedge fund PMs, prop desks, and a small number of discretionary traders. The toolkit was expensive: Bloomberg terminals, expert networks, proprietary NLP pipelines, teams of sector analysts.
PEAD persisted for decades in public equities partly because not enough people could do the reading. AI changes the economics entirely. The natural product implication is to give every user the capabilities of a hedge fund PM: AI analysts that ingest information across every source, social feeds, onchain data, news, community sentiment, product signals, filings, synthesize it in real time, and surface actionable trades (incidentally, this is what we are doing at Freeport).
That doesn’t eliminate markets. It makes them better. More participants interpreting information means faster price discovery, better capital allocation, and the creation of entirely new market types around events, narratives, attention, and emerging realities that older financial rails are too slow and too rigid to support.
Disclaimer
The information provided on TheLogbook (the “Substack”) is strictly for informational and educational purposes only and should not be considered as investment or financial advice. The author is not a licensed financial advisor or tax professional and is not offering any professional services through this Substack. Investing in financial markets involves substantial risk, including possible loss of principal. Past performance is not indicative of future results. The author makes no representations or warranties about the completeness, accuracy, reliability, suitability, or availability of the information provided.
This Substack may contain links to external websites not affiliated with the author, and the accuracy of information on these sites is not guaranteed. Nothing contained in this Substack constitutes a solicitation, recommendation, endorsement, or offer to buy or sell any securities or other financial instruments. Always seek the advice of a qualified financial advisor before making any investment decisions.