
The Unreasonable Effectiveness of Order Books
Ten Case Studies of Markets Aggregating Information

“Everything is priced in” is supposed to be a joke. Nonetheless, beneath the joke is a real claim, and the real claim is much stranger than the joke suggests. It is the claim that prices in a deep enough liquid market routinely reflect information that no single participant possesses, that markets are smarter than markets have any right to be. This post is a collection of the case studies that earn the claim.
1 · Challenger and Morton Thiokol, January 28, 1986
The space shuttle Challenger lifted off from Kennedy Space Center at 11:38 a.m. Eastern Standard Time on Tuesday, January 28, 1986. Seventy-three seconds later it broke apart. All seven crew members died. The public watched live on television.
Four publicly traded prime contractors had built the shuttle. Lockheed had built the orbiter’s flight software. Rockwell International had built the orbiter itself. Martin Marietta had built the external fuel tank. Morton Thiokol had built the two solid-rocket boosters. By the time the New York Stock Exchange closed that afternoon, three of those four stocks had fallen between two and three percent.
The fourth, Morton Thiokol, had fallen 11.86%. Trading in Thiokol had effectively dried up within minutes of the explosion. In the half-hour following the launch, the tape showed only six prints in the stock.
The Rogers Commission, the official investigation, would not report for another five months. When it did, it identified the failure mode as an O-ring seal in the right solid rocket booster that had lost flexibility in cold weather and allowed hot exhaust gases to breach the seal. The booster was Morton Thiokol’s. The O-ring was Morton Thiokol’s. Engineers inside the company had warned the night before the launch that cold temperatures would compromise the seal; the warning had been overridden.
The market did not need to read the Rogers Commission report to know any of this. By the close on January 28, hours after the failure, the equity market had decisively concentrated the loss on the responsible firm. Michael Maloney and J. Harold Mulherin published the canonical study of this event in 2003 in the Journal of Corporate Finance (“The Complexity of Price Discovery in an Efficient Market: The Stock Market Reaction to the Challenger Crash”).
They considered every alternative explanation. Could insider trading by Thiokol employees have produced the pattern? No: option flows and SEC filings showed no unusual activity. Could selective news leaks have done it? No: contemporaneous wire reports did not single out Thiokol that day. Could the market have just been moving on the largest contractor, by coincidence the responsible one? No: by size, Lockheed and Rockwell were larger. The market had aggregated the diffuse engineering knowledge of thousands of analysts, suppliers, ex-employees, and tracking specialists into a price that named the culprit hours after the event and months before the official investigators.

2 · Three Mile Island and nuclear utilities, March 28, 1979
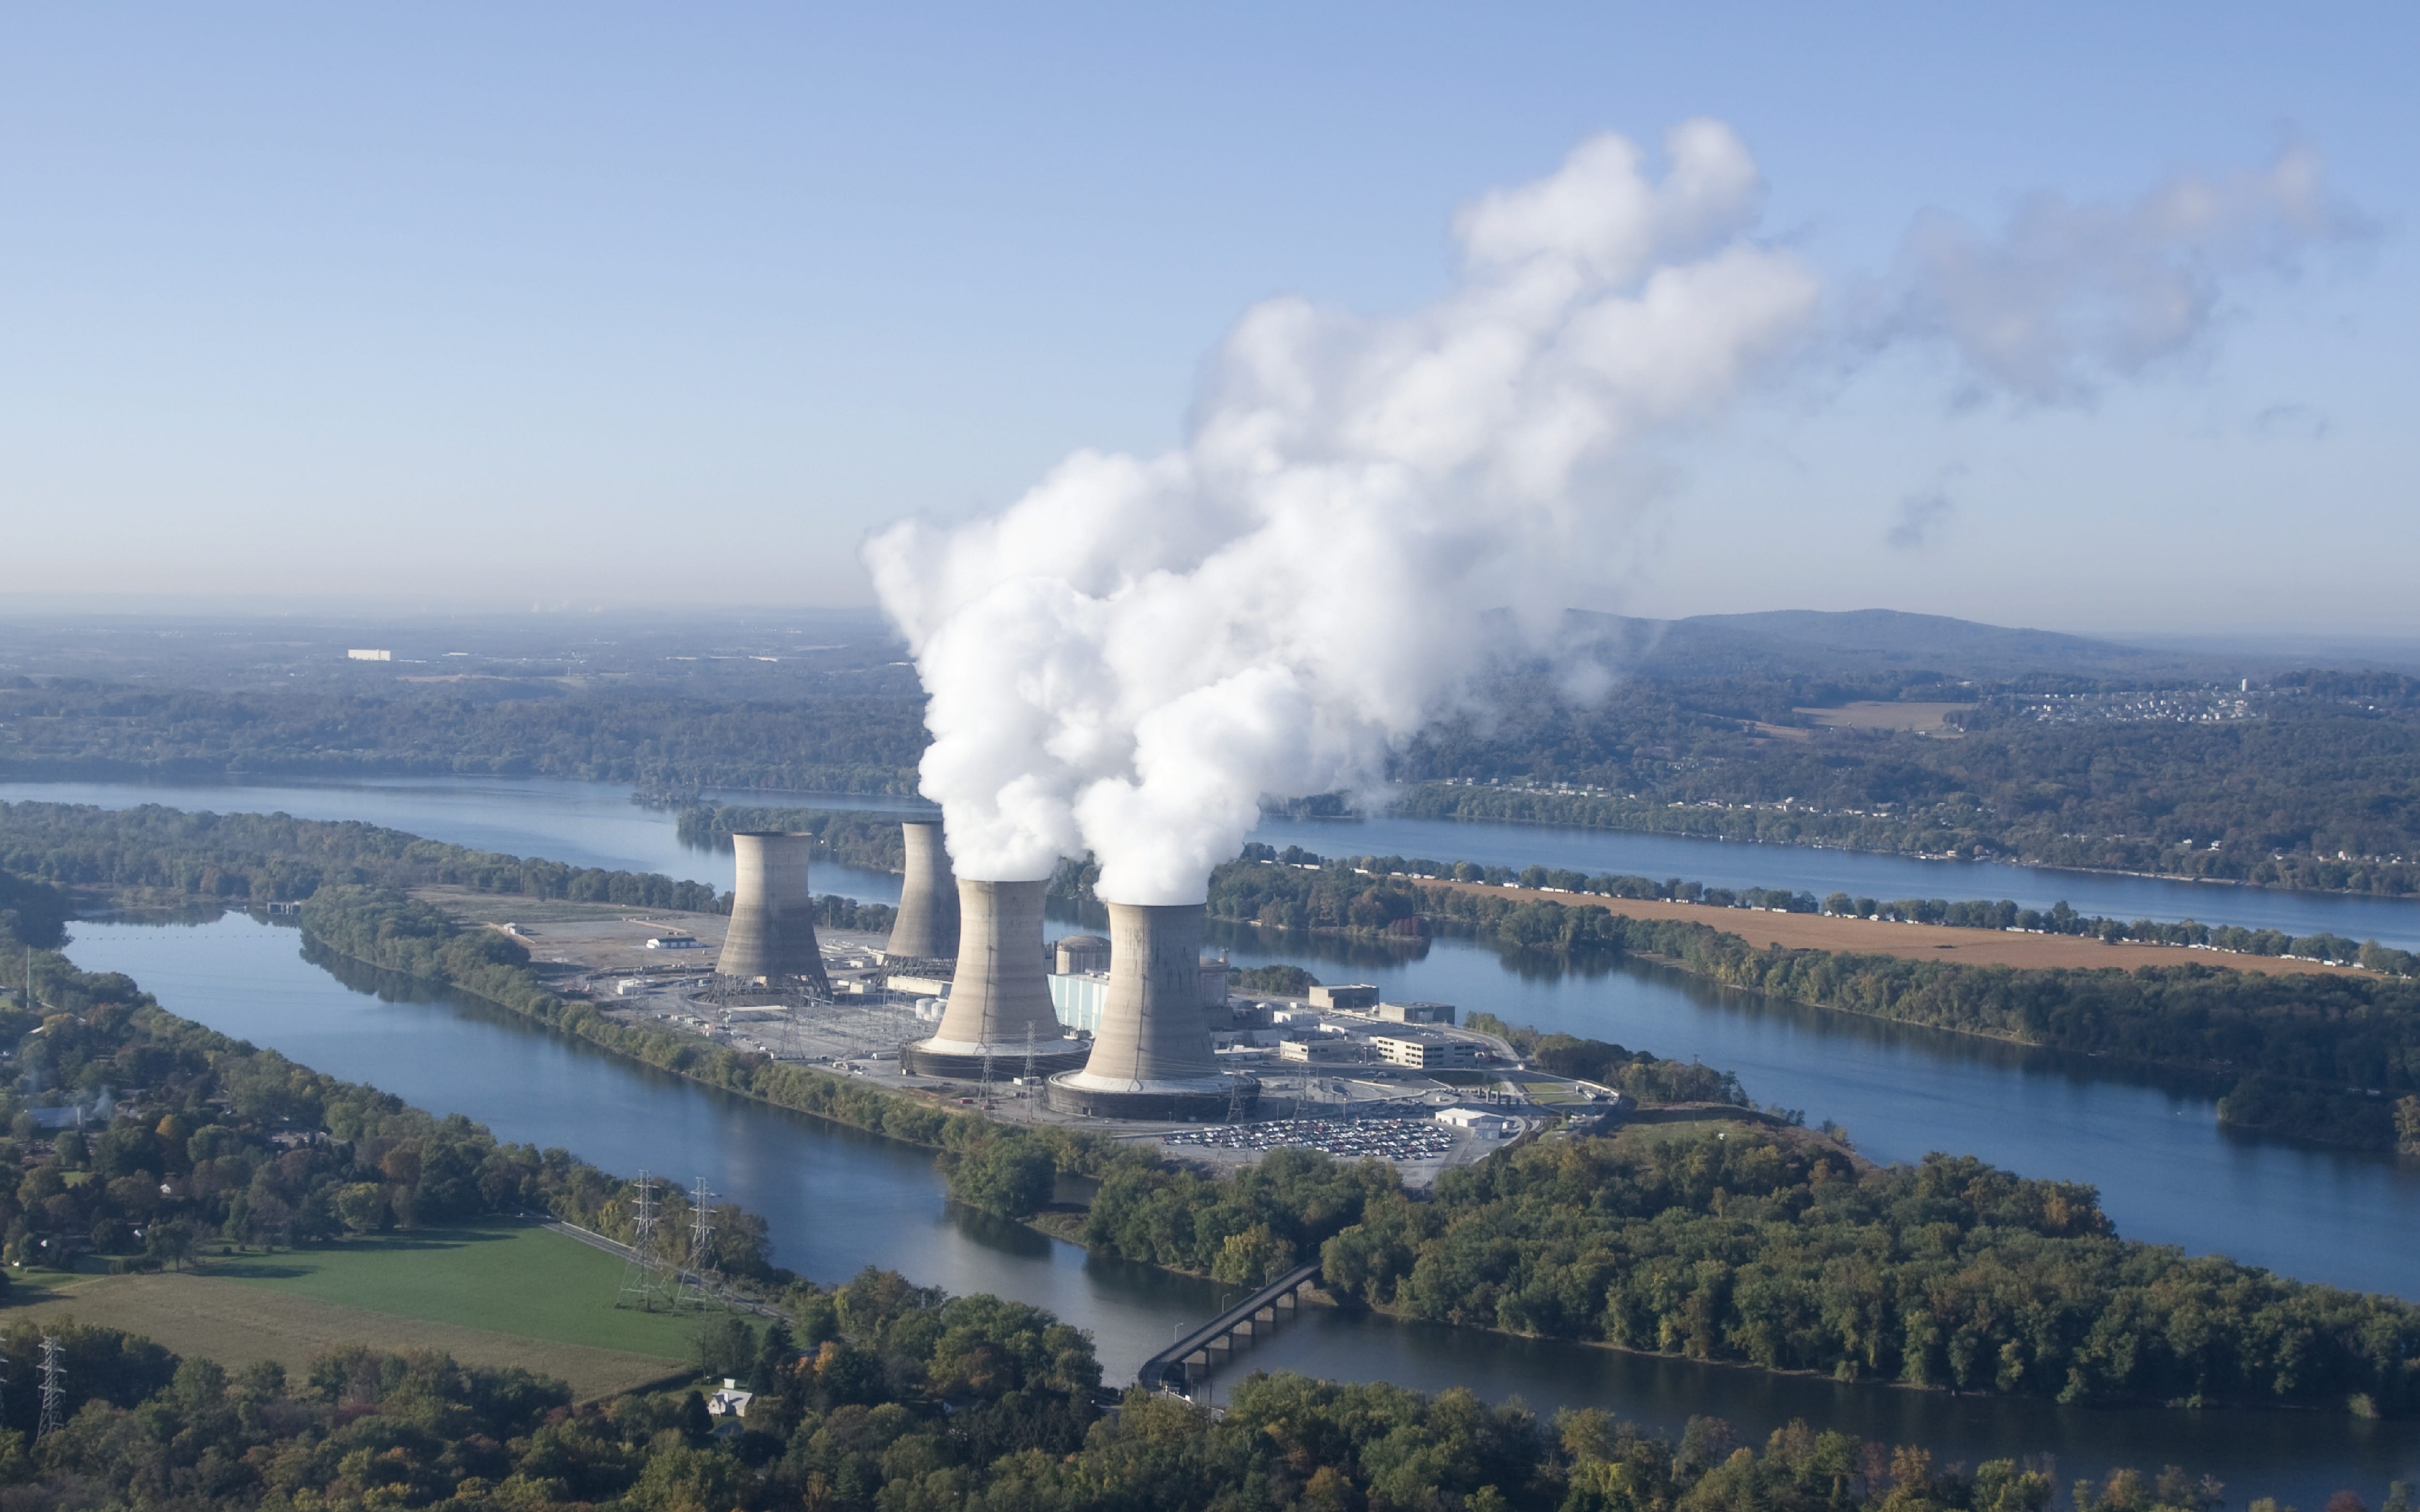
At 4 a.m. on Wednesday, March 28, 1979, the Unit 2 reactor at Three Mile Island Generating Station near Middletown, Pennsylvania, lost feedwater to its steam generators. The cascade of failures over the next several hours produced a partial meltdown of the reactor core, the most severe accident in the history of US commercial nuclear power. General Public Utilities Corporation (GPU), the utility that owned the plant, traded on the New York Stock Exchange.
GPU equity opened down sharply on Wednesday morning and continued to fall over the following two weeks. By April 11, the stock had lost approximately 40% of its pre-accident value, erasing roughly $230 million in market capitalization. The cleanup and decommissioning would eventually cost approximately $1 billion in 1979 dollars, spread over fourteen years.
The interesting feature for the cross-sectional thesis is the contagion. Bowen, Castanias, and Daley published an event study in the 1983 Journal of Financial and Quantitative Analysis tracking the abnormal returns of all publicly traded electric utilities with nuclear exposure in the two weeks after Three Mile Island. Utilities with operating nuclear plants earned negative abnormal returns of approximately 9% in the two weeks following the accident. Utilities with planned but unbuilt nuclear capacity earned negative returns of approximately 6%. Pure non-nuclear utilities earned essentially zero abnormal returns. The market priced the regulatory and operating cost of a generic “nuclear future” before the Kemeny Commission’s October 1979 report and before the multi-year regulatory tightening that would actually follow.
Hill and Schneeweis (1983, Journal of Finance) document the same cross-sectional pattern in the bond market: utility bonds with greater nuclear exposure widened in spread by amounts proportional to the share of nuclear capacity in their issuer’s generation mix. The accident on the morning of March 28 was processed across both equity and bond markets within days, with the cross-section of exposure correctly identified before any official investigation.
Three Mile Island is the closest US analogue to the Challenger story for industrial disasters. The pricing was cleaner because the responsible firm was a single corporate entity rather than a cross-section of contractors. The contagion to similarly exposed firms was visible within weeks. The decades-long shadow on US nuclear construction (no new ground-up reactor was ordered in the United States between 1977 and 2012) was implicit in the price the market wrote in April 1979.
3 · Lithium-6 and the hydrogen bomb, 1954
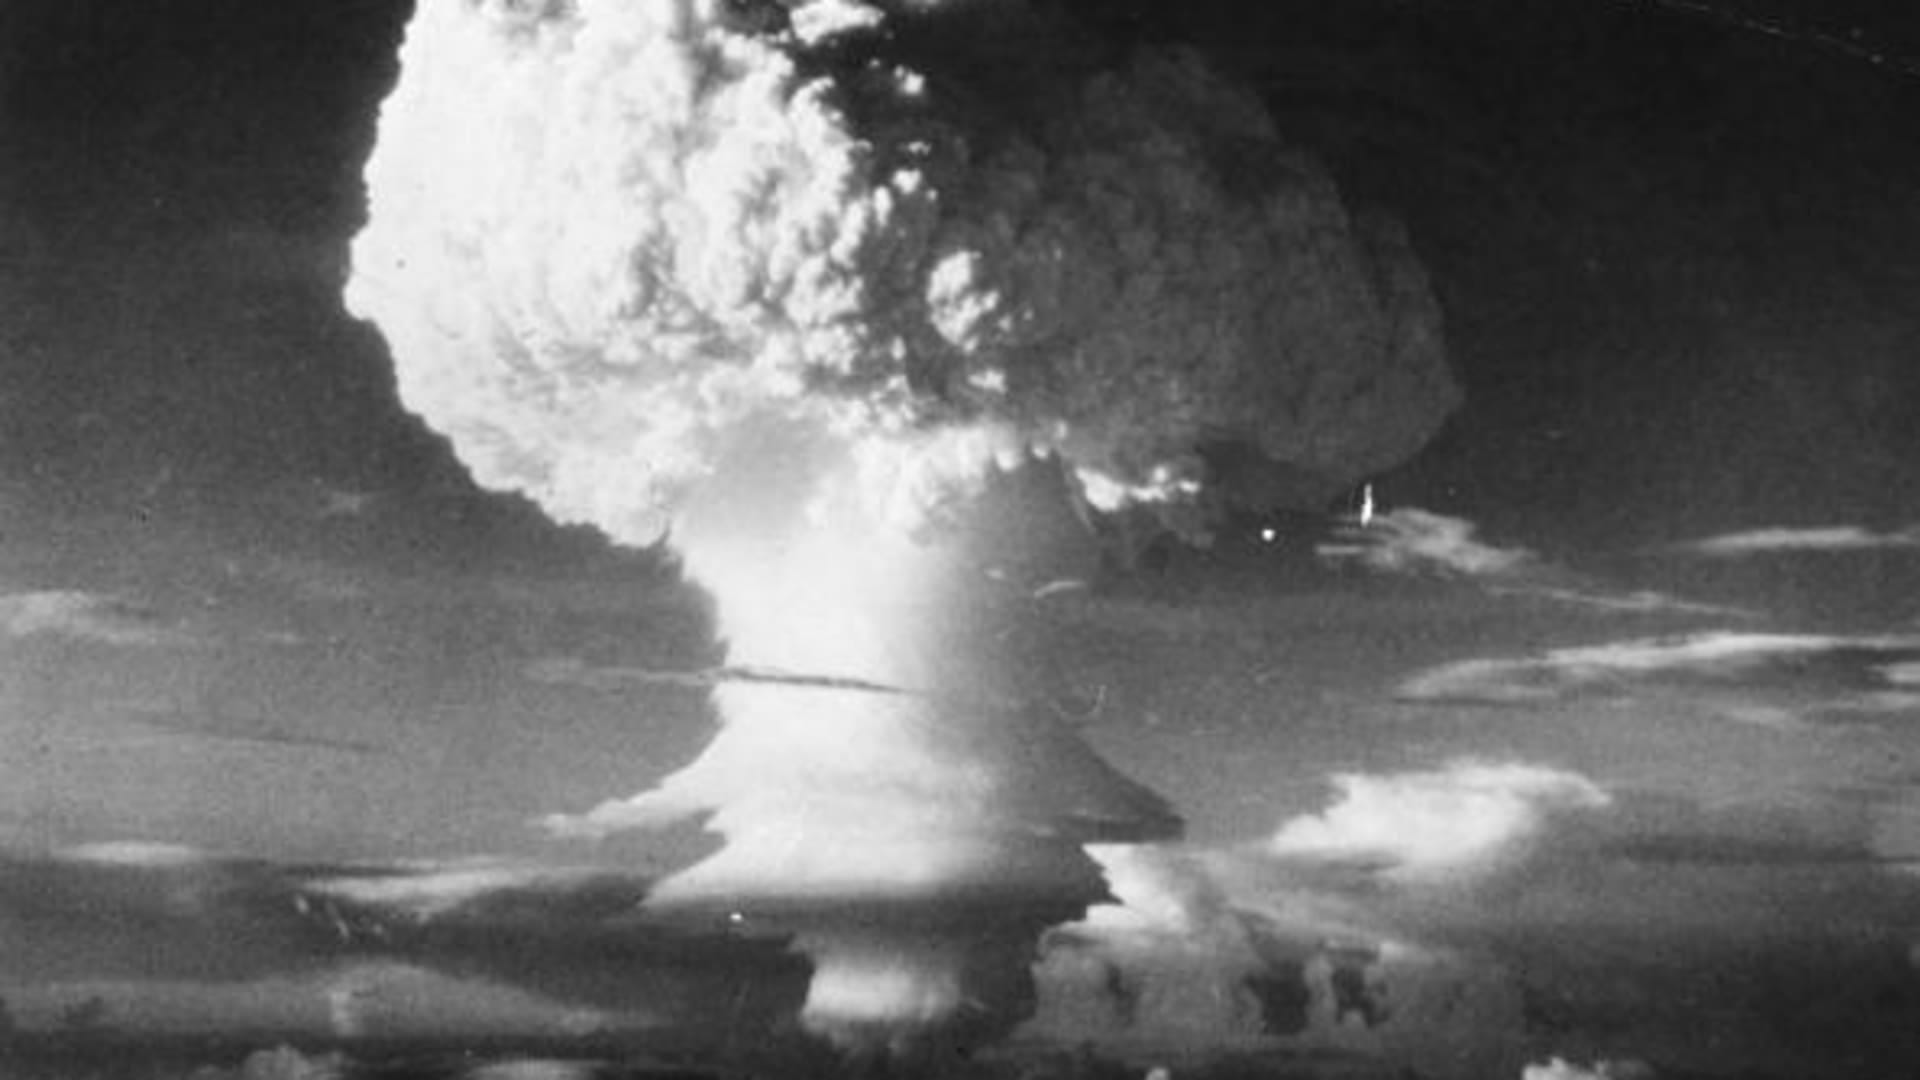
The United States detonated its first deployable hydrogen bomb on March 1, 1954, in the Castle Bravo test at Bikini Atoll. The bomb yielded 15 megatons, two and a half times the predicted yield, contaminating a Japanese fishing boat and producing the first international fallout incident. The design of the bomb was classified at the highest level. Specifically classified was the choice of fusion fuel: not liquid deuterium, as the earlier Ivy Mike test had used, but solid lithium-6 deuteride, which made the bomb small enough to be dropped from an aircraft.
That a chemical lithium compound was the fuel of the hydrogen bomb would not be public knowledge for decades. The United States government continued to classify the design choice through the late 1970s.
In 1954, the equity of the publicly traded lithium-producing firms rose 461%. The Dow Jones Industrial Average rose 50% in the same year. Other rare-earth and radioactive-metal producers (uranium, thorium, beryllium) stayed roughly flat. Lithium Corporation of America alone earned an abnormal return of approximately 28% within one month of Castle Bravo, settling into the 461% annual return as the year progressed.
This story is preserved because Armen Alchian, working at RAND, ran what was probably the world’s first formal event study on it. Alchian observed the lithium-stock spike, inferred from the magnitude and timing that lithium had to be the fusion fuel, and wrote a short paper describing the inference. RAND’s security officers read the paper, recognized that Alchian had reconstructed a classified design choice from public price data, and ordered the paper destroyed.
The story would have been lost entirely if Joseph Newhard had not reconstructed it from CRSP-era data in his 2014 Journal of Corporate Finance paper, “The Stock Market Speaks: How Dr. Alchian Learned to Build the Bomb.” Newhard’s chain of inference is the same as Alchian’s: there were only a handful of publicly traded lithium producers, only one Teller-Ulam-design choice plausibly explained the spike, and the timing aligned to within weeks of the Bravo shot. The market had priced a state secret.
The interesting epistemic point is that nobody who bought lithium stock in 1954 needed to know what lithium was being used for. They needed to know that demand for lithium was spiking, that the buyers were not commercial chemists or battery manufacturers (lithium-ion batteries were 30 years away), and that the most plausible large-volume buyer was the federal government. The chain “government is buying lots of lithium” plus “the government is at war for nuclear primacy” plus “lithium has plausible nuclear-relevant chemistry” was available to anyone with a chemistry textbook and a procurement contact. The market did the rest.
4 · The Cuban Missile Crisis and city-level geography of risk, 1962
For thirteen days in October 1962, the United States and the Soviet Union came closer to nuclear war than at any other point in the Cold War. Soviet missiles had been emplaced in Cuba. The Kennedy administration debated invading; the Soviets debated launching; analysts on both sides put their probability of nuclear exchange between 10% and 50%.
The aggregate equity market response to this was, by reputation, modest. The S&P 500 fell roughly 3% over the crisis window, less than other 1962 drawdowns. For decades, financial economists treated this as a puzzle: surely the largest existential-risk event of the postwar era should have moved the market more than a routine recession.
David Andrew Finer’s 2022 working paper “No Shock Waves through Wall Street?” reframed the question. The aggregate index is the wrong place to look. The cross-section is the right place. Finer geocoded the headquarters cities of every NYSE-listed firm, overlaid them with declassified Cold War expert maps of expected Soviet-strike probability per US city (which weighted by economic importance, military bases, and political symbolism), and ran a panel regression of firm-level abnormal returns during October 16 to October 28, 1962. Firms headquartered in cities estimated by intelligence analysts as higher-priority Soviet targets earned significantly lower returns during the crisis window, controlling for industry, size, and aggregate risk.
The market was, on a daily basis through the crisis, implicitly computing a city-level actuarial estimate of where the missiles would land if they were launched. The pricing was not the gross expected value of nuclear war (which would have wiped out everything roughly equally, since US economic activity would not survive a full exchange). It was the conditional pricing: given that we get a strike, where does the strike land, and what fraction of the surviving economic activity does each firm represent? That information was distributed across thousands of analysts, military commentators, journalists, and informed amateurs. The market aggregated it into a usable cross-section.
The corollary that Finer’s paper makes most clearly: aggregate-level event studies can fail to detect aggregation that is happening cleanly at the cross-sectional level. The Cuban Missile Crisis “puzzle” of modest aggregate response dissolves once you look at the right unit of analysis.

5 · Orange juice futures and the National Weather Service, 1984
Richard Roll’s “Orange Juice and Weather,” published in the American Economic Review in December 1984, is the foundational academic paper on market-as-information-aggregator. The setup is mundane and the finding is elegant.
Frozen-concentrate orange juice futures trade on what was then the New York Cotton Exchange. The largest US orange-juice-producing region is Central Florida. Cold weather in Central Florida damages the orange crop and pushes up futures prices. The National Weather Service issues forecasts of overnight low temperatures in the Central Florida region. Roll asked the obvious question: do OJ futures contain information about the weather beyond what NWS forecasts already contain?
The answer was yes. Statistically significant. If OJ closed above its open, the NWS forecast for that night was systematically too high (too warm) by an amount that could not be explained away by reporting noise. The market knew, by close of trading, things about the night’s weather that the NWS would only catch up to in its next-day revision.
The mechanism is not magic. Physical traders watch citrus groves directly, monitor freight rates for trucks moving to harvest areas, observe grower hedging volumes, and read agricultural-economist newsletters that the NWS forecaster does not. Each individual data source is small. Aggregated through the futures price, the data sources add up to a more accurate temperature forecast than the federal government produces.
The Roll paper became the touchstone of the 1980s “wisdom of crowds” literature and the inspiration for the climactic scene of the film Trading Places. It remains the cleanest case of a financial market visibly outperforming a competing federal information aggregator on the federal aggregator’s home turf.

6 · Pre-announcement runups in M&A targets
The single most quantified version of “everything is priced in” is the corporate-control literature. Whenever a public company is bought by another, the target’s stock price rises sharply on the day the deal is publicly announced. The interesting question is: how much of that rise has already happened in the weeks before the announcement?
Keown and Pinkerton, in 1981 in the Journal of Finance, ran the first careful study. They looked at 194 mergers between 1975 and 1978. Across the 25 trading days before the public announcement, the target’s stock price drifted up by roughly 40 to 50 percent of the total takeover premium it would eventually earn. The drift was concentrated in the final week before announcement, but it started visible at least a month earlier.
This is leakage. The corporate decision to acquire is known to a small set of executives, lawyers, bankers, and consultants, none of whom is supposed to trade on it. Some fraction of them do. The drift is the trace of that trading in the public tape.
Lisa Meulbroek, in 1992, looked at the question from the inside out. She used SEC enforcement records of insider-trading prosecutions to identify the specific days on which insiders had illegally traded ahead of merger announcements. On those days, the target stock earned an abnormal return of approximately 3% on average. The total pre-announcement runup of roughly 30 to 50% of the eventual premium could be substantially accounted for by insider activity that the SEC later detected. Two implications. First, illegal trading is detectable by both regulators (through enforcement) and by the market (through the runup). Second, the market processes the information about an impending deal in essentially real time, even when the information is being introduced through illegal channels.
The M&A runup literature is the most replicated finding in this entire collection. It is one of the strongest pieces of evidence that public markets price information that is, in the most literal sense, private at the moment of pricing.

7 · The Iowa Electronic Markets and the wisdom of small-money political crowds
The Iowa Electronic Markets opened in 1988 as a research project at the University of Iowa. Real-money political-event contracts (with strict per-trader position limits, around $500 in the early years) traded on US presidential elections and many other races.
Across five presidential election cycles from 1988 to 2004, Berg, Nelson, and Rietz documented (in International Journal of Forecasting, 2008) that the IEM vote-share contract was closer to the eventual outcome than the contemporaneous Gallup-style poll on 74% of polling days. The advantage grew at longer forecast horizons: at 100+ days out, the IEM beat polls by a wider margin than at 1 day out.
The result was striking because the IEM had no obvious informational advantage over polls. The traders were a few hundred academics and graduate students. The position limits made it impossible for a single well-informed trader to dominate the price. And yet the aggregate of these small bets, across a small market, outperformed the most sophisticated polling apparatuses of major newspapers.
The mechanism is the wisdom-of-crowds story plus a selection effect. Polls survey a random sample of voters and ask them to predict their own behavior; the answer is noisy because voters are bad at predicting their own behavior. The IEM surveyed a self-selected sample of analytical hobbyists who were betting on the outcome they actually expected; the answer was less noisy because their incentive was accuracy.
The two methods are not measuring the same thing. The IEM was measuring belief, weighted by the strength of belief plus the willingness to risk capital. That turned out to be a better predictor than self-reported voter intent. The IEM was the proof of concept for the larger prediction-market industry that would emerge two decades later.
8 · DARPA’s Policy Analysis Market, 2003
The Defense Advanced Research Projects Agency, between 2001 and 2003, designed a real-money prediction market called the Policy Analysis Market. The market was to trade contracts on Middle East political and military events: civil unrest in specific countries, regime stability, conflict probabilities. The intended use was as an alternative information aggregator for the intelligence community. The hypothesis, owing largely to Robin Hanson, was that aggregated bets from a wide pool of informed traders would outperform analyst panels.
On July 28, 2003, Senators Ron Wyden and Byron Dorgan held a press conference labeling PAM an “assassination market” and accusing the Pentagon of incentivizing terrorism. The Secretary of Defense cancelled the program the next morning. The hypothesis was never tested at scale.
This case is in the essay because of what it implies rather than what it demonstrated. The Pentagon’s own R&D arm had concluded that the prediction-market mechanism was the most promising alternative to analyst-led intelligence aggregation. The CIA’s Studies in Intelligence journal published a favorable retrospective in 2006. The premise that markets aggregate intelligence-relevant information better than analyst panels was, inside the relevant institutions, taken seriously enough to fund.
The implementation was killed for political optics, not because the underlying claim had been disproved. The current generation of real-money political prediction markets (Polymarket, Kalshi, others) is the descendant of the IEM and PAM.
9 · Trump and the peso, election night 2016
US polls began closing on Tuesday, November 8, 2016. Pre-election polls had shown Hillary Clinton with a roughly 4-percentage-point national lead and approximately 70 to 90% probability of victory across the major poll aggregators. Equity futures and the Mexican peso were positioned for a Clinton win.
The Mexican peso had been trading as a proxy for the election outcome for months. Donald Trump’s anti-trade and immigration positions implied a structurally weaker peso, and the peso had been rallying or selling off in approximate inverse correlation to Trump’s daily polling odds. As state-level results began arriving Tuesday evening, the peso began collapsing. By 10:30 p.m. Eastern, with Florida and North Carolina trending Republican, USD/MXN had moved from approximately 18.5 to 20.8, a 12% peso decline in roughly three hours. By the overnight low, the peso had fallen approximately 13% intraday, its sharpest move in over twenty years.
US Treasury yields moved in parallel. The 10-year Treasury yield rose from approximately 1.86% at the 4 p.m. cash close to over 2.05% by Asia morning, an overnight move of nearly 20 basis points. Equity futures fell sharply through the night and then reversed into a rally that would carry the S&P 500 to new highs over the following weeks.
The interesting feature of the night for the everything-is-priced-in thesis is the speed. AP did not call the race for Trump until 2:29 a.m. Eastern, November 9. The peso, the bond market, and the equity futures had effectively priced the Trump-win outcome by midnight, two and a half hours earlier. The signal was being read off state-level returns and county-level precinct data, parsed in real time by traders watching the AP feeds and the New York Times’ “needle” updates, and impressed onto deep, liquid global markets before the formal media call.
Polymarket did not exist as a serious market in 2016 (it would launch in 2020). The Iowa Electronic Markets did, and its Trump contract crossed 50% around the same time the peso was crossing 20.5. The aggregate of FX, rates, and small prediction markets identified the eventual outcome hours before the formal media infrastructure caught up. The 2016 election night is the proof-of-concept for the 2024 election night, scaled down by an order of magnitude in market depth and lengthened by an order of magnitude in lag.

10 · Deepwater Horizon, April 2010
The Deepwater Horizon offshore drilling rig exploded on April 20, 2010, killing 11 workers and beginning the largest marine oil spill in US history.
Three publicly traded companies were directly involved. BP owned the leased well and was the operator. Transocean owned the rig itself. Halliburton had cemented the wellbore. Over the next two months, equity in all three fell sharply, with cross-sectional dispersion that tracked specific assignments of fault as they emerged.
BP fell from approximately $59.48 on April 19 to $27 on June 25, a loss of approximately 55%, erasing approximately $90 billion in market capitalization. Options volume on BP increased twentyfold during the response period. Credit-default-swap spreads on BP debt widened by hundreds of basis points. Transocean fell less sharply but visibly. Halliburton’s response was muted, anticipating the eventual finding that its cementing work had been compliant with industry practice.
The market priced the eventual liability allocation in approximate real time. The final civil and criminal penalties against BP, settled over the following years, totaled approximately $60 billion. The market’s June 2010 low for BP reflected a present-value estimate of this exposure within roughly the right order of magnitude, computed within two months of the spill and well before any formal liability assignment.
The interesting cross-sectional pattern is that Transocean and Halliburton equity moved by amounts proportional to their eventual liability shares, while BP took the brunt. This is the same mechanism Maloney and Mulherin documented for Challenger: the market resolves the cross-section of responsibility correctly while the official investigation is still organizing.

Conclusion · What the price knows
Prices in deep markets routinely identify causes, allocate blame, forecast weather, and call elections before the institutions formally tasked with these jobs have finished assembling their conference rooms. The market’s edge is not omniscience. It is aggregation: it pools the small, partial, often unconscious knowledge of thousands of marginally informed people, weights each contribution by the willingness of its holder to risk capital, and prints a number. The number is almost always closer to the truth than any single contributor could be, and frequently closer than the formal expert apparatus mobilized to answer the same question.
The standard objection is that markets are “just speculation,” that derivatives are gambling, that prediction markets monetize tragedy. The objection has the structure of an aesthetic complaint rather than an empirical one. Speculation is the name we give to forecasting when we disapprove of the forecaster. The trader who shorted Morton Thiokol within minutes of the Challenger explosion was not desecrating the dead; he was, in the act of trading, telling the rest of the market who had built the failed component. Risk has to be priced by someone.
The choice is not between a world with speculation and one without it. The choice is between a world that prices risk through people with skin in the game, and a world that prices it through people without.
A society that took this seriously would be quicker to legalize the instruments that aggregate information and slower to ban them. It would treat loud calls to outlaw prediction markets the way it treats calls to outlaw thermometers: as the complaints of people who dislike what the instrument reads. None of this requires believing markets are sacred. It requires only noticing what they have repeatedly done, and asking, with humility, what we might be missing when we insist on doing it ourselves.
Disclaimer
The information provided on TheLogbook (the “Substack”) is strictly for informational and educational purposes only and should not be considered as investment or financial advice. The author is not a licensed financial advisor or tax professional and is not offering any professional services through this Substack. Investing in financial markets involves substantial risk, including possible loss of principal. Past performance is not indicative of future results. The author makes no representations or warranties about the completeness, accuracy, reliability, suitability, or availability of the information provided.
This Substack may contain links to external websites not affiliated with the author, and the accuracy of information on these sites is not guaranteed. Nothing contained in this Substack constitutes a solicitation, recommendation, endorsement, or offer to buy or sell any securities or other financial instruments. Always seek the advice of a qualified financial advisor before making any investment decisions.