
Valuation Multiples
What They Miss & Why They Differ?

This post partially summarizes some of the major arguments made by Michael Mauboussin and Dan Callahan of Morgan Stanley in one of their reports. The topic is timely because the S&P 500 is approaching historically high levels of P/E. In this post, we explained what multiples miss and why they are becoming less informative, as well as why different multiples can send different signals. We also discuss how alternative measures of earnings can add insight and link multiples to fundamental drivers of value.
Multiples Miss Growth Potential
The value of a company is the cash flow it is expected to generate, discounted by the undiversifiable risk to which that cash flow is exposed. A valuation multiple (most commonly P/E or EV/EBITDA) attempts to compress information that a full DCF model would contain into a single figure; naturally, some information is lost in the compression.
In both P/E and EV/EBITDA, the numerator of the multiple is a figure that seeks to capture the present value of the long-term cash flows for the life of the business. The price of a stock is proportional to its market cap, which is the market’s implied value for shareholders’ long-term returns; similarly, enterprise value is simply the market’s implied value for the long-term return to both stock and bondholders.
In the denominator of multiples, we have earnings per share and earnings before interest, taxes, depreciation, and amortization, respectively. Immediately, we see that a valuation multiple is comparing a numerator representing market-implied long-term value with a denominator reflecting realized short-term performance.
Yet the central determinant of corporate value is the magnitude and sustainability of return on invested capital; firms create value when their investments earn returns in excess of the opportunity cost of capital. Multiples provide no consideration of the scale of a firm’s reinvestment or whether it will generate sufficient returns. This is the main consideration that multiples miss.
The classic example of a sector with high multiples is technology, where growth prospects can be enormous. Initial high multiples might appear excessive or unjustifiable when viewed through a traditional valuation lens; however, tech companies often operate with growth strategies involving significant reinvestment—aiming to scale rapidly, innovate, and capture large market shares. By leveraging initial investments in technology and user acquisition, these firms can achieve network effects that significantly increase their value by creating barriers to entry for competitors and establish a dominant market position (an economic moat if you want to be euphuistic, a monopoly if you do not).
Multiples Miss Intangible Investments
Shifts in how companies invest have also caused degradation in the ability of multiples to capture the relative cheapness or richness of valuation. Most traditional businesses invested primarily in tangible assets such as factories and machinery; by GAAP, these investments were recorded on the balance sheet and expensed on the income statement through depreciation over time. For example, a firm may spend $1 million on a machine, but the negative impact of that spending shows up in earnings over 20 years and thus does not immediately affect valuation multiples by much.
However, in an economy where value is generated not by tangible capital formation but by ideas (i.e. intellectual property), know-how (i.e. institutional knowledge), and relationships (i.e. network effects), the majority of investments are in intangible assets—think customer acquisition, branding, research, employee training, etc. From an accounting perspective, these outlays are recorded as SG&A and R&D expenses, which reduces current earnings. That is to say, the same million-dollar investment will now reduce earnings immediately and make the valuation seem high.
Multiples are supposed to reflect the magnitude and return on investment. But the shift to intangible investments and the way companies record them in financial statements has significantly reduced that ability. To reiterate with our two examples above, consider the case where a $1 million investment in a machine and in research will produce the exact same cash flows for the firm over the next 20 years with the same risks. The investment in the machine will reduce current earnings by 1/20 compared to research (assuming linear depreciation), and hence the company that has invested in the machine will look cheaper compared to the company that invested in research, even though their return on investment is the same. The effect is purely due to accounting standards and the way we define valuation multiples.
P/E & EV/EBITDA
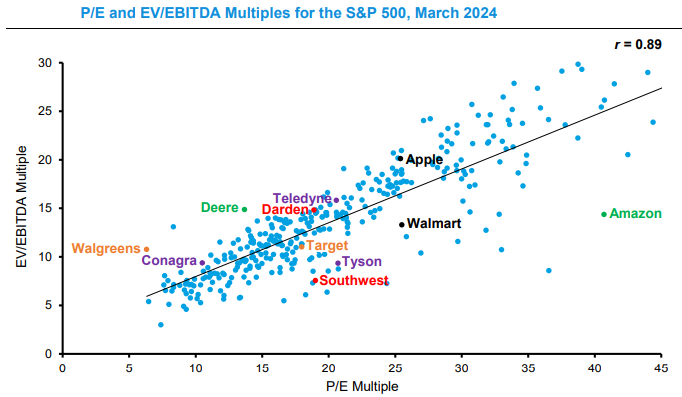
Not surprisingly, there is a strong correlation between P/E and EV/EBITDA. We now discuss intuitively why this correlation is not perfect.
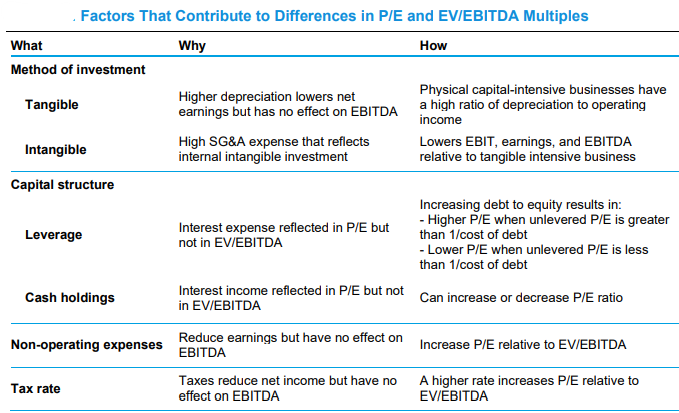
The price-to-earnings (P/E) ratio is typically called a levered metric because it takes into account the net income of a company, which is affected by the company's financial structure, including its debt levels. Interest payments on debt reduce net income, which is reflected in the P/E ratio. Conversely, the enterprise-value-to-EBITDA (EV/EBITDA) ratio is considered unlevered because EBITDA (earnings before interest, taxes, depreciation, and amortization) excludes interest expenses and thus does not directly reflect the impact of a company’s debt.
The P/E is almost always higher than the EV/EBITDA for a profitable company. To see why, assume no debt or cash so that P equals EV. E is going to be lower than EBITDA because taxes exist. Since the numerator is the same and the denominator is lower, the P/E multiple will be higher than the EV/EBITDA multiple. This relationship does not hold for a company with negative net income where the multiple of P/E would be negative and the multiple of EV/EBITDA would be positive. This discussion points to the main reasons that P/E and EV/EBITDA multiples differ.
Do Adjusted Measures Obfuscate or Illuminate?
Regulations require companies to report earnings that conform with generally accepted accounting principles (GAAP); however, the vast majority of companies in the S&P 500 also report non-GAAP earnings. The question is whether companies share non-GAAP figures to provide the market with better information or to flatter their results. Evaluating whether to adjust for certain items in non-GAAP results involves understanding how each component relates to the fundamental drivers of firm value such as cash flow predictability, core operational efficiency, and growth potential. Here are some personal takes on the most common recurring exclusions and their relevance to these value drivers.
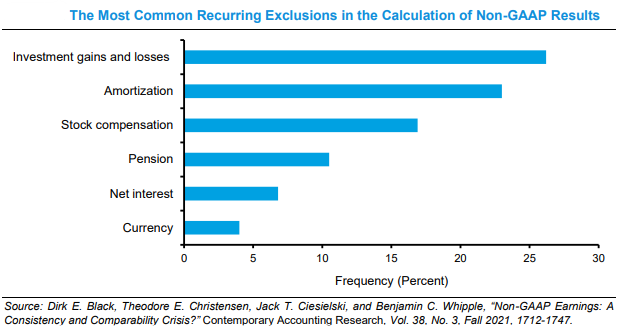
Investment Gains and Losses are excluded because they fluctuate with market movements rather than core operations. For instance, Berkshire Hathaway’s GAAP results swung from a $23 billion loss in 2022 to a $96 billion gain in 2023, yet its operating earnings remained a steadier $30.9 billion and $37.4 billion. Excluding volatile unrealized gains and losses gives investors a clearer view of the ongoing business performance.
Amortization of Intangibles, like goodwill from acquisitions, is a non-cash charge that can obscure current operations. Microsoft’s acquisition-related amortization can significantly depress net income despite stable core profits. Stripping out this expense highlights the profitability of its operational activities without the accounting drag.
Stock Compensation and Pension Costs both reflect real obligations but can muddy comparability. A fast-growing tech startup may issue large stock-option grants, inflating non-GAAP earnings if excluded, while General Motors’ pension assumptions can swing materially year-to-year. Including these expenses ensures a more honest view of the true cost of talent and long-term liabilities.
Finally, Net Interest and Currency Fluctuations tie earnings to financing choices and external exchange rates rather than operational efficiency. AT&T’s heavy debt load leads to sizable interest expenses that, if omitted, overstate its telecom earnings. Similarly, Coca-Cola’s global revenues can be distorted by dollar-rate shifts; adjusting for this keeps the focus squarely on beverage-business performance.
Disclaimer
The information provided on TheLogbook (the "Substack") is strictly for informational and educational purposes only and should not be considered as investment or financial advice. The author is not a licensed financial advisor or tax professional and is not offering any professional services through this Substack. Investing in financial markets involves substantial risk, including possible loss of principal. Past performance is not indicative of future results. The author makes no representations or warranties about the completeness, accuracy, reliability, suitability, or availability of the information provided.
This Substack may contain links to external websites not affiliated with the author, and the accuracy of information on these sites is not guaranteed. Nothing contained in this Substack constitutes a solicitation, recommendation, endorsement, or offer to buy or sell any securities or other financial instruments. Always seek the advice of a qualified financial advisor before making any investment decisions.
Great writeup! Aswoth Damodaran has a good paper on the problems with the accounting treatment of R&D (linked below), and has some interesting ways to account for them in the models on his website. Based on the contents of your article, is your suggestion to create "pro-forma multiples" and adjust our ratios by making your described adjustments to the inputs? Do we know why it's not standard practice to do this already?
Thanks for the article!
https://pages.stern.nyu.edu/~adamodar/pdfiles/papers/R_D.pdf